Using Help | Contents | Index Back 387
Adobe Illustrator Help Using Graphs
Using Help | Contents | Index Back 387
To change graph types:
1 Select the graph.
2 Choose Object > Graph > Type, or double-click the graph tool.
3 Choose Graph Options from the pop-up menu at the top left of the Graph Type
dialog box.
4 Click the desired graph type. The options for the particular type of graph you selected
appear in the bottom half of the dialog box.
5 Click the desired graph options and click OK.
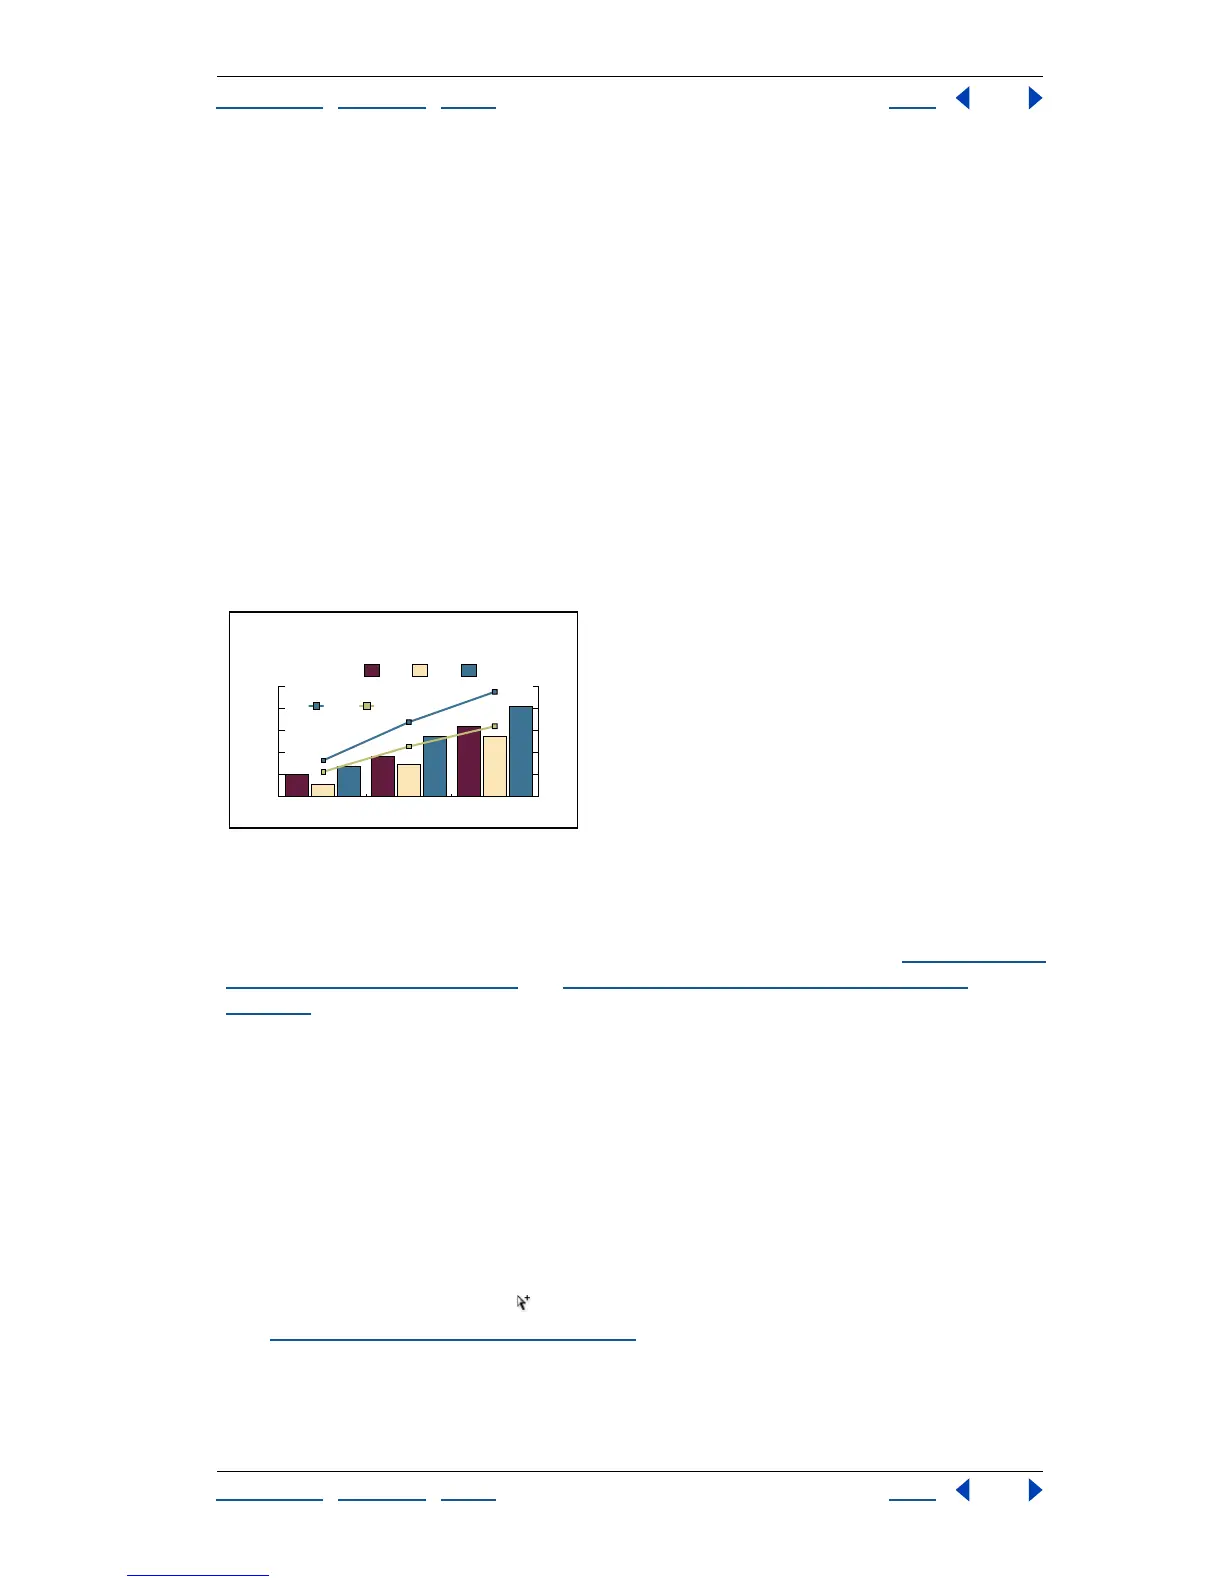
Combining different graph types
You can combine different graph types in one graph. For example, you may want one set
of data to appear as a column graph and other sets of data to appear as a line graph.
You can combine any type of graph with any other, with the exception of scatter graphs.
Scatter graphs cannot be combined with any other graph type.
Graph with both columns and lines
If a graph uses more than one graph type, you may want one set of data along the right
axis and the other set of data along the left axis. In this way, each axis measures different
data. For information on assigning data to different sides of the graph, see “
Specifying the
value axis position” on page 383 and “Setting axis tick mark and label options” on
page 384.
Note: To create two axes for a graph with different scales, you need to assign data to the
left side (or the bottom side) and different data to the right side (or the top side) using the
Value Axis menu in the Graph Type dialog box. If you select the entire graph and the On
Both Sides option, both axes will display identical scale values.
If you use stacked column graphs with other graph types, be sure to use the same axis for
all sets of data that are represented by stacked column graphs. If some sets of data use the
right axis while other sets of data use the left axis, the column heights may be misleading
or may overlap.
To combine different graph types:
1 Use the group-selection tool to select a set of data and its legend box or legend line.
(See “
Selecting parts of a graph” on page 388.) Once you select the series, you can then
change the graph type in the Graph Type dialog box.
2 Choose Object > Graph > Type, or double-click the graph tool.
0%
50%
100%
150%
200%
250%
$0
$5
$10
$15
$20
$25
Wholesale
Retail
Product CProduct BProduct A
199019801970
Varietal Retail
Price per Unit
Retail and Wholesale
Price Index
(Retail 1970
Price level = 100%)