Using Help | Contents | Index Back 393
Adobe Illustrator Help Using Graphs
Using Help | Contents | Index Back 393
6 Using the selection tool , select the entire design, including the rectangle and
any type.
7 Choose Object > Group to group the design.
8 Choose Object > Graph > Design.
9 Click New Design. You see a preview of the selected design.
10 Click Rename. Name the design, and click OK. Then click OK again.
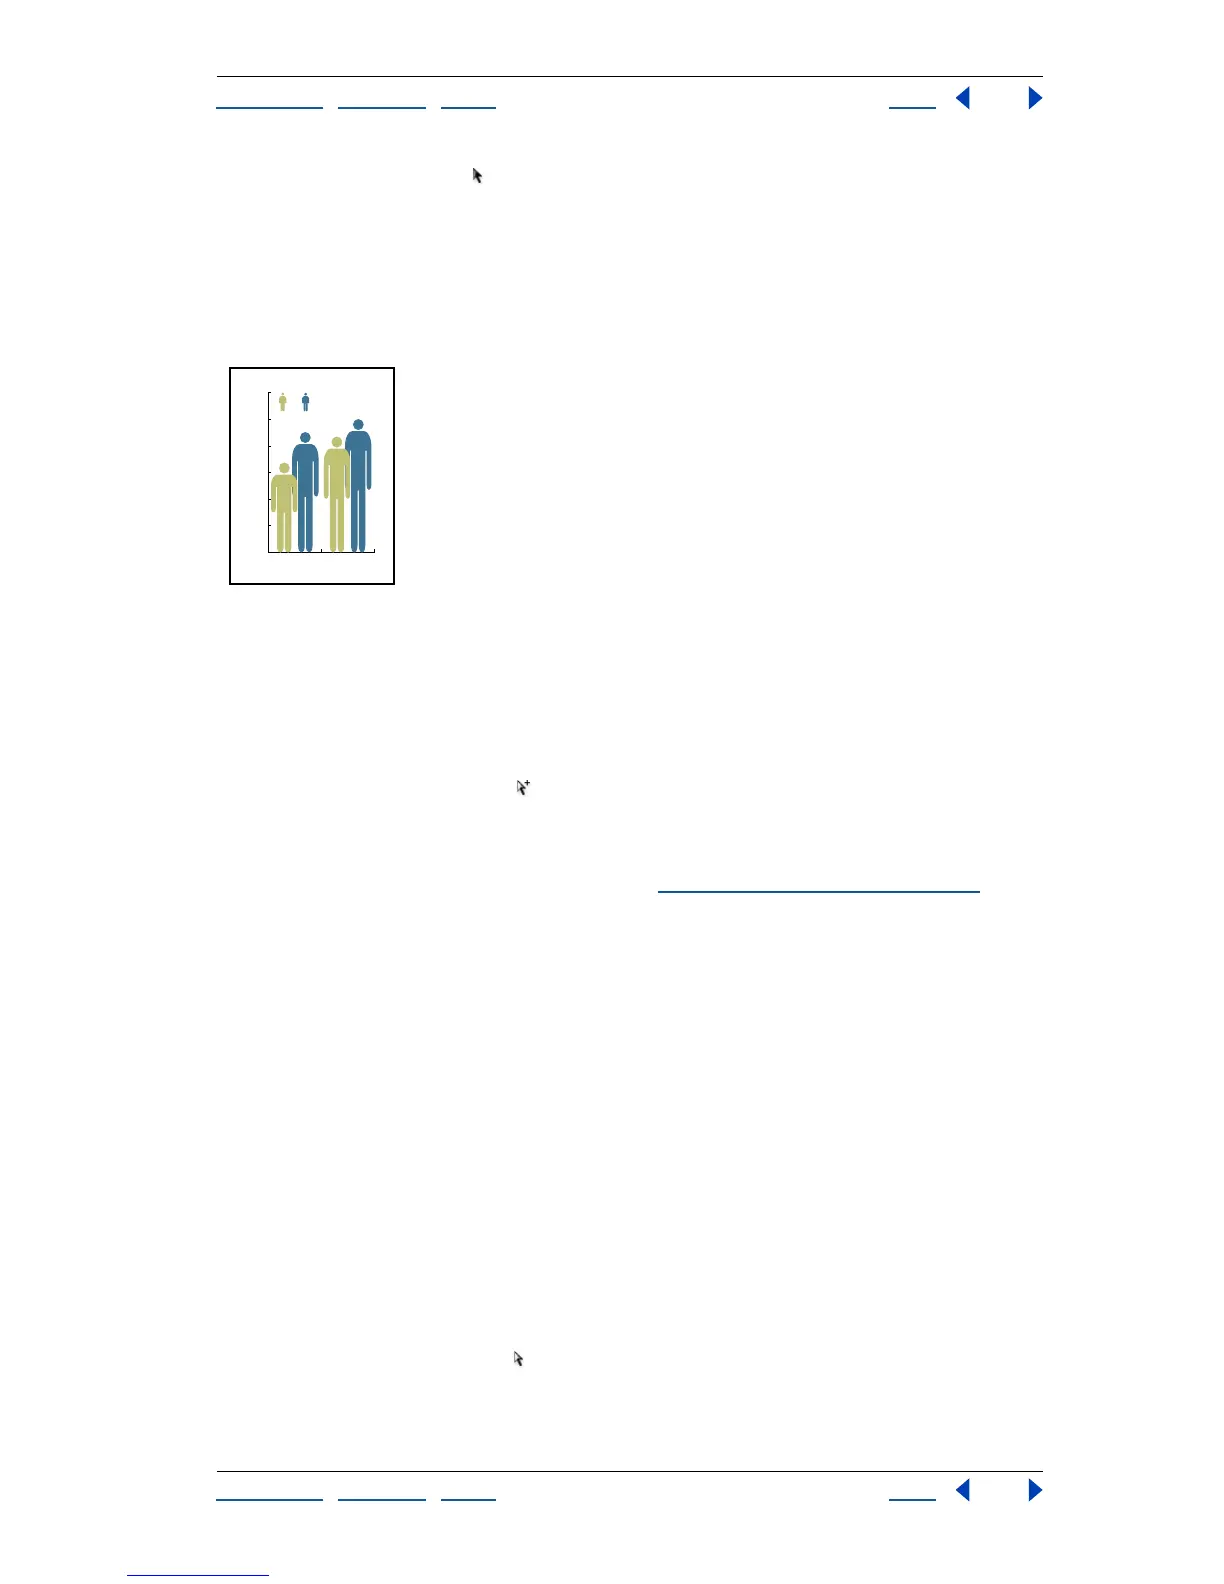
Sliding graph design with data totals
Applying graph designs to a graph
Once you have created a graph design, you can apply it either as a column in a column
graph, as a bar in a bar graph, or as a marker in a line or scatter graph.
To use a graph design in a column graph or bar graph:
1 Use the group-selection tool to select the columns or bars you want to fill with the
design, or select the entire graph.
2 Choose Object > Graph > Column.
3 Select a column design type, as described in “
About graph designs” on page 389.
If you choose the Repeating Column Type, enter a value in the Each Design Represents
text box for what each design represents. Also select whether to chop or scale any
fractions of the design in the For Fractions pop-up menu. Chop Design cuts off a fraction
of the top design as necessary; Scale Design scales the last design to fit in the column.
4 Select the design you want to use; you see a preview of the selected design. Click OK.
To create a marker design:
1 Start by copying a marker rectangle from the graph, and using the rectangle as the
backmost object, to set the marker size.
2 Make the marker artwork the size you want it to be in the graph, even if it’s larger than
the marker rectangle you copied.
3 Once you’ve got the marker design the way you want it, select the design, then choose
Object > Graph > Design, and click New Design.
4 Click the Rename button, enter a new name for the design, and click OK.
To use a marker design in a line or scatter graph:
1 Use the direct-selection tool to select the markers and the legends in the graph that
you want to replace with a design. Do not select any lines.
2 Choose Object > Graph > Marker. Select a design, and click OK.
0
50
100
150
200
250
300
BA
19901980
180
250
240
280