23Aermec cod. 5806715_00 12.01
NRP 0200-0750
EN
− The correc ve factors of cooling capacity and
input power take into account the presence
of glycol and the diff erence in evapora on
temperatures.
− The pressure drop correc on factor considers the
diff erent fl ow rate resul ng from the applica on
of the water fl ow rate correc on factor.
− The water fl ow rate correc on factor is calculated
to keep the same ∆t that would be present with
the absence of glycol.
NOTE:
On the following page an example is given to help
graph reading.
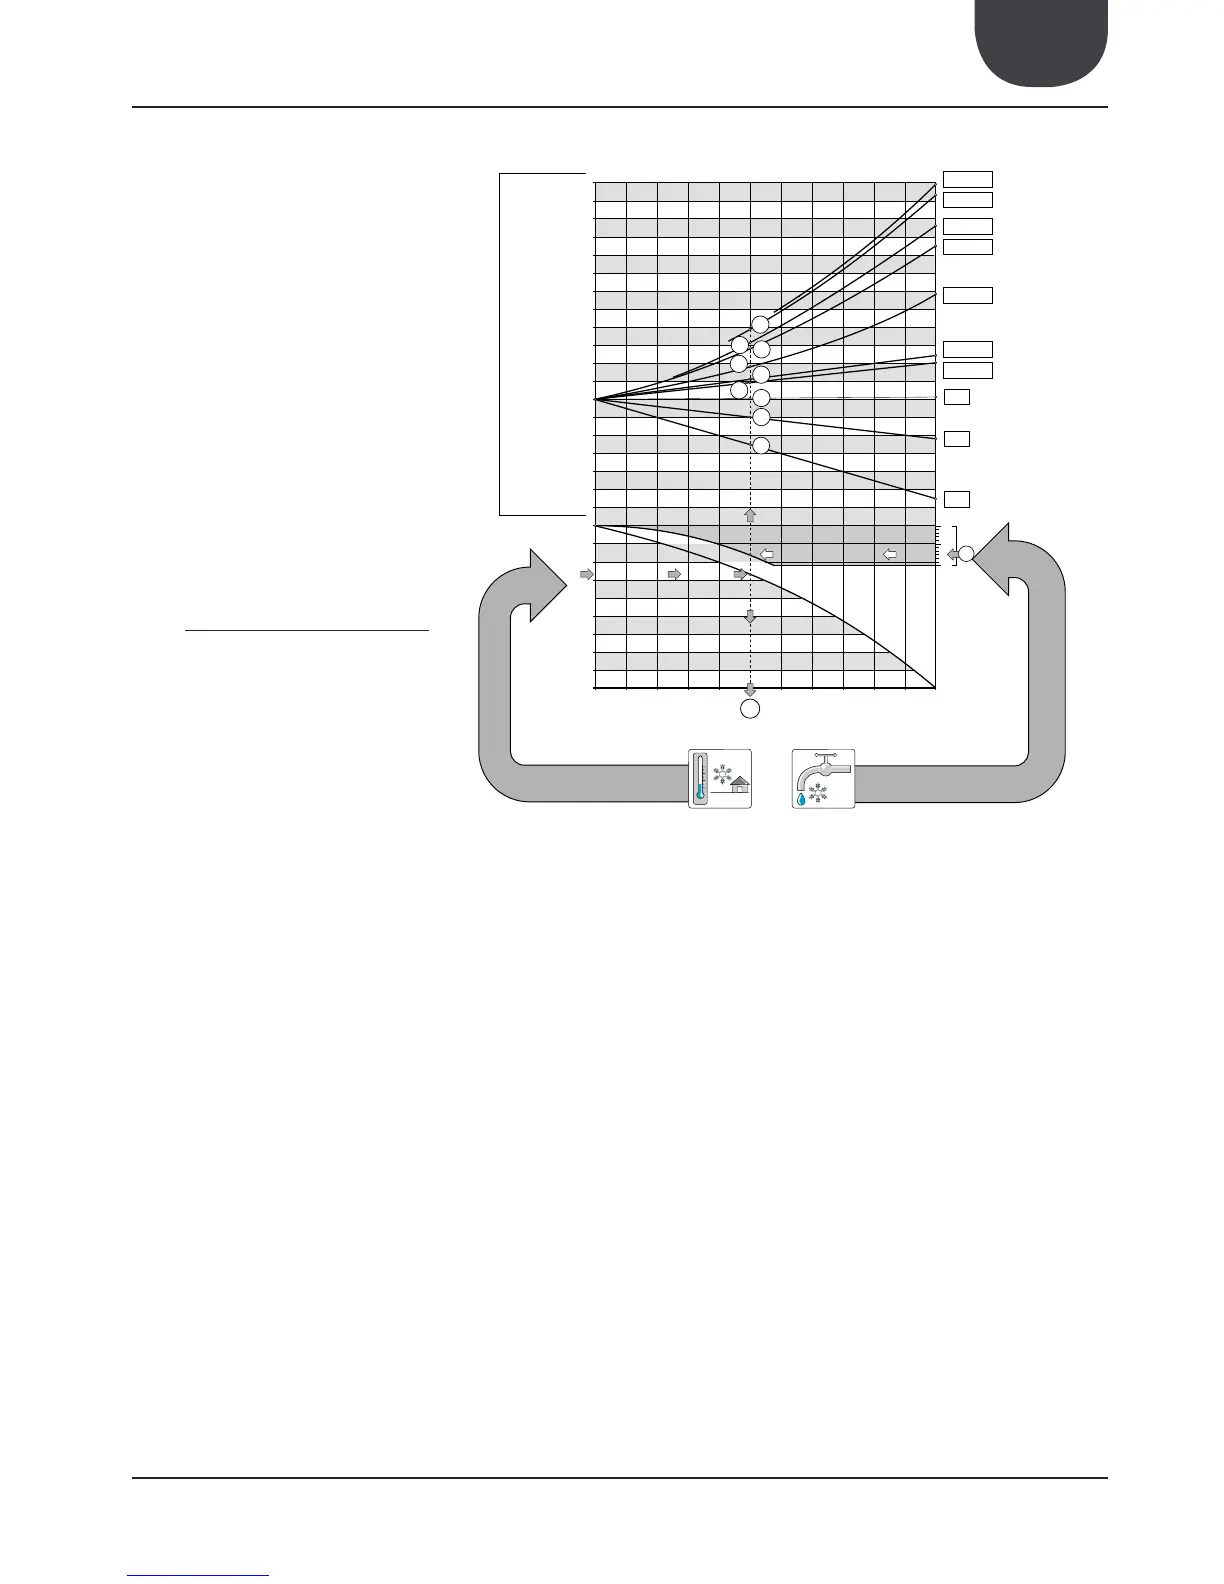
To determine the percentage of glycol required, see
diagram below; this percentage calculation can take
into consideration one of the following factors.
Depending on which fluid is considered (water or
air), the graph is interpreted by the right or left side
at the crossing point on the curves with the external
temperature line or the water produced line. A point
from which the vertical line will pass is obtained
and this will distinguish both glycol percentage and
relative correction coefficients.
14.1. HOW TO INTERPRET GLYCOL CURVES
The curves shown in the diagram summarise
a significant number of data, each of which is
represented by a specific curve. In order to use these
curves correctly it is first necessary to make some
initial reflections.
− If you wish to calculate the percentage of glycol
on the basis of the external air temperature,
enter from the le axis and on reaching the curve
draw a ver cal line, which in turn will intercept
all the other curves; the points obtained from
the upper curves represent the coeffi cients
for the correc on of the cooling capacity and
input power, the fl ow rates and the pressure
drops (remember that these coeffi cients must
be mul plied by the nominal value of the
size in ques on); while the glycol percentage
value recommended to produce desired water
temperature is on the lower axis.
− If you wish to calculate the percentage of glycol
on the basis of the temperature of the water
produced, enter from the right axis and on
reaching the curve draw a ver cal line, which
in turn will intercept all the other curves; the
points obtained from the upper curves represent
the coeffi cients for the correc on of the cooling
capacity and input power, the fl ow rates and the
pressure drops (remember that these coeffi cients
must be mul plied by the nominal value of the size
in ques on); while the lower axis recommends
the glycol percentage value necessary to produce
water at the desired temperature.
− Initial rates for “EXTERNAL AIR TEMPERATURE”
and “TEMPERATURE OF PRODUCED WATER”,
are not directly related, therefore it is not
possible to refer to the curve of one of these
rates to obtain corresponding point on the curve
of the other rate.
14. ETHYLENE GLYCOL SOLUTIONS
KEY:
Pc Corrective factors for cooling capacity
Pe Corrective factors of the input power
Ph Corrective factor for heating capacity
ΔP (1) Corrective factor for pressure drops with an average fluid temp. = -3.5°C
ΔP (2) Corrective factor for pressure drops with an average fluid temp. = 0.5°C
ΔP (3) Corrective factor for pressure drops with an average fluid temp. = 5.5°C
ΔP (4) Corrective factor for pressure drops with an average fluid temp. = 9.5°C
ΔP (5) Corrective factor for pressure drops with an average fluid temp. = 47.5°C
Qw (1) Corrective factor for pressure drops (evap) with an average fluid temp. = 9.5°C
Qw (2) Corrective factor of flow rates (condenser) with an average fluid temp. = 47.5°C
NOTE
Although the graph shows a max external air temperature of -40°C, the unit operational
limits must be complied with.
2.20
2.10
2.00
1. 90
1. 80
1. 70
1. 60
1. 50
1. 40
1. 30
1. 20
1.10
1. 00
0.99
0.98
0.97
0.96
0.95
0.94
5
0
-5
-10
-15
-20
-25
-30
-35
-40
05101520
25
30 35 40 45 50 55
-6
0
5
0.975
0.990
1.000
1.090
1.110
1.180
1.280
1. 310
1.390
-3
Pc
Ph
Qw (2)
Qw (1)
ΔP (5)
ΔP (4)
ΔP (3)
ΔP (2)
ΔP (1)
Pe
Temperature of produced water
External air temperature
Glycol %
Corrective factors