Contents ▲ 125 ▼ Index
to ensure a good result even at very low signal-to-noise ratios. Choose a single sample.
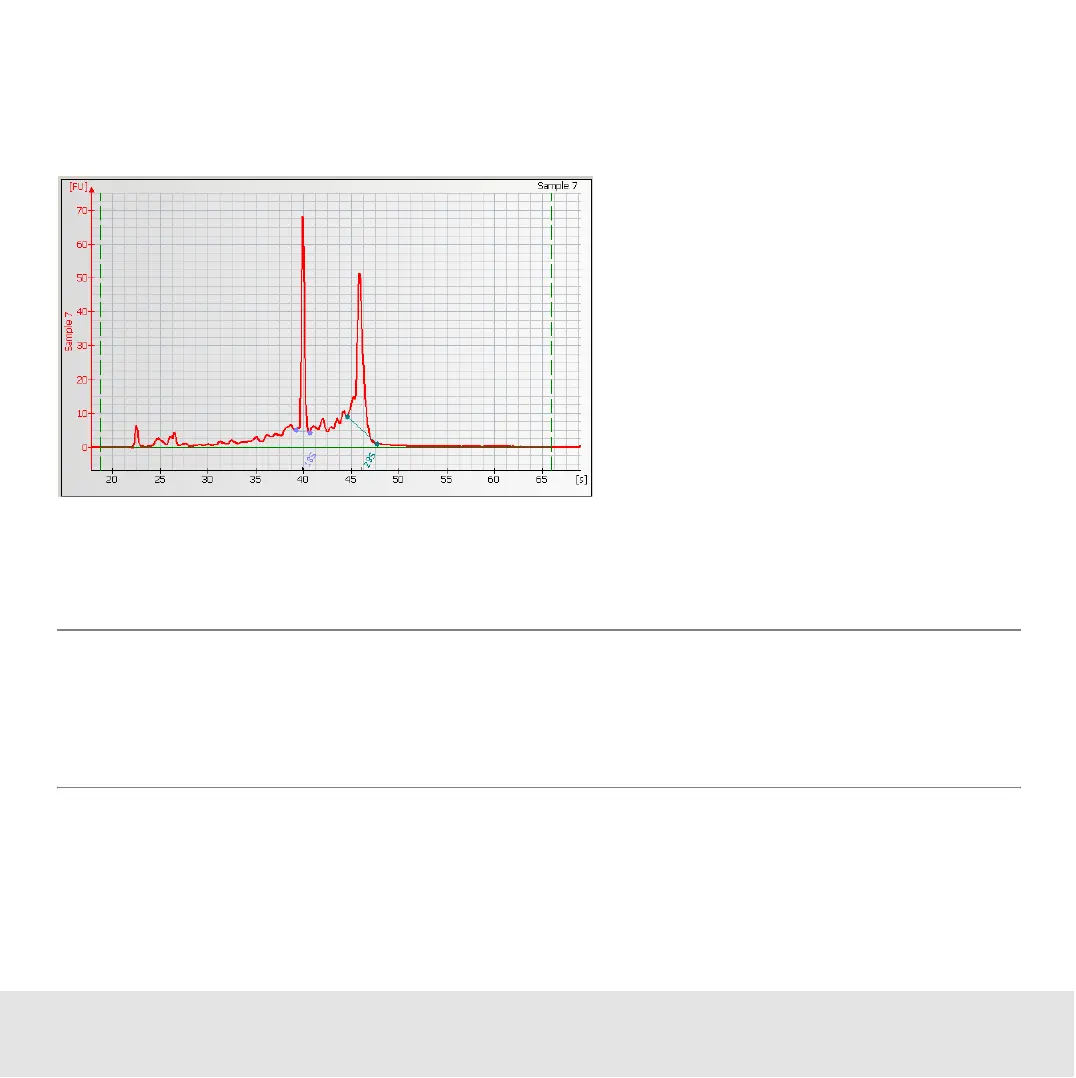
Two vertical green long-dashed lines indicating the setpoints for the Start and End Times
(with the baseline drawn between them) are displayed in the window.
Move the cursor over the long-dashed line on the left (Start Time setting) and drag the
line to the desired position. Do the same with the long-dashed line on the right (End Time
setting) until you have a flat baseline.
NOTE
Changing the start and end times will change the calculated RNA concentration. It
might be convenient to pause the automatic analysis (Electropherogram > Pause
Automatic Analysis) until all changes are done.

 Loading...


