Contents ▲ 247 ▼ Index
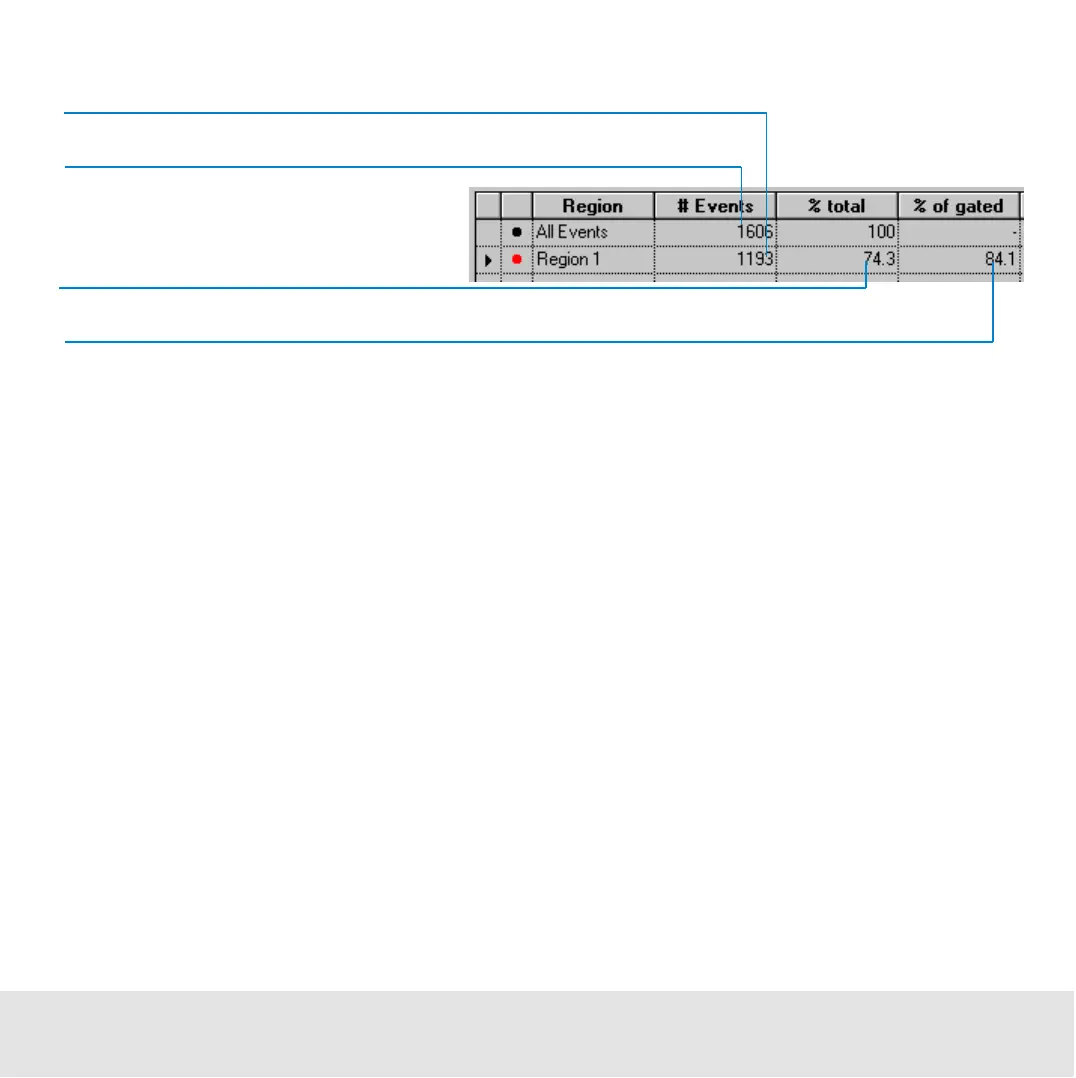
The results of the dot plot evaluation are numerically displayed in the result table:
Evaluating Apoptosis Assays
The apoptosis assay can be used to examine how many apoptotic cells are within a living
cell population. Dead (or necrotic) cells can be excluded from the evaluation.
For a detailed description on how to evaluate the results using histograms and regions,
refer to “Using Histograms for Evaluation” on page 212 and “Using Dot Plots for
Evaluation” on page 233.
Living or dead cells
In most cases, you want to know whether cells are dead or alive at a specific time. For
this, you can use calcein-AM as living cell dye, for example. This dye accumulates in
intact cells, whereas it will leak out of damaged cells. Once inside the cells, the colorless
AM ester is cleaved by esterases, resulting in the formation of the highly fluorescent
calcein. The number of events resulting from a calcein-related staining thus gives you the
All measured events
Events covered by the region
Amount of living cells in relation to all measured cells
Amount of living cells with high antibody binding in relation to all living cells

 Loading...


