7-22 Agilent 4155C/4156C VXIplug&play Driver User’s Guide, Edition 4
Sample Application Programs Using VEE
Using sample2.vee
Panel Display
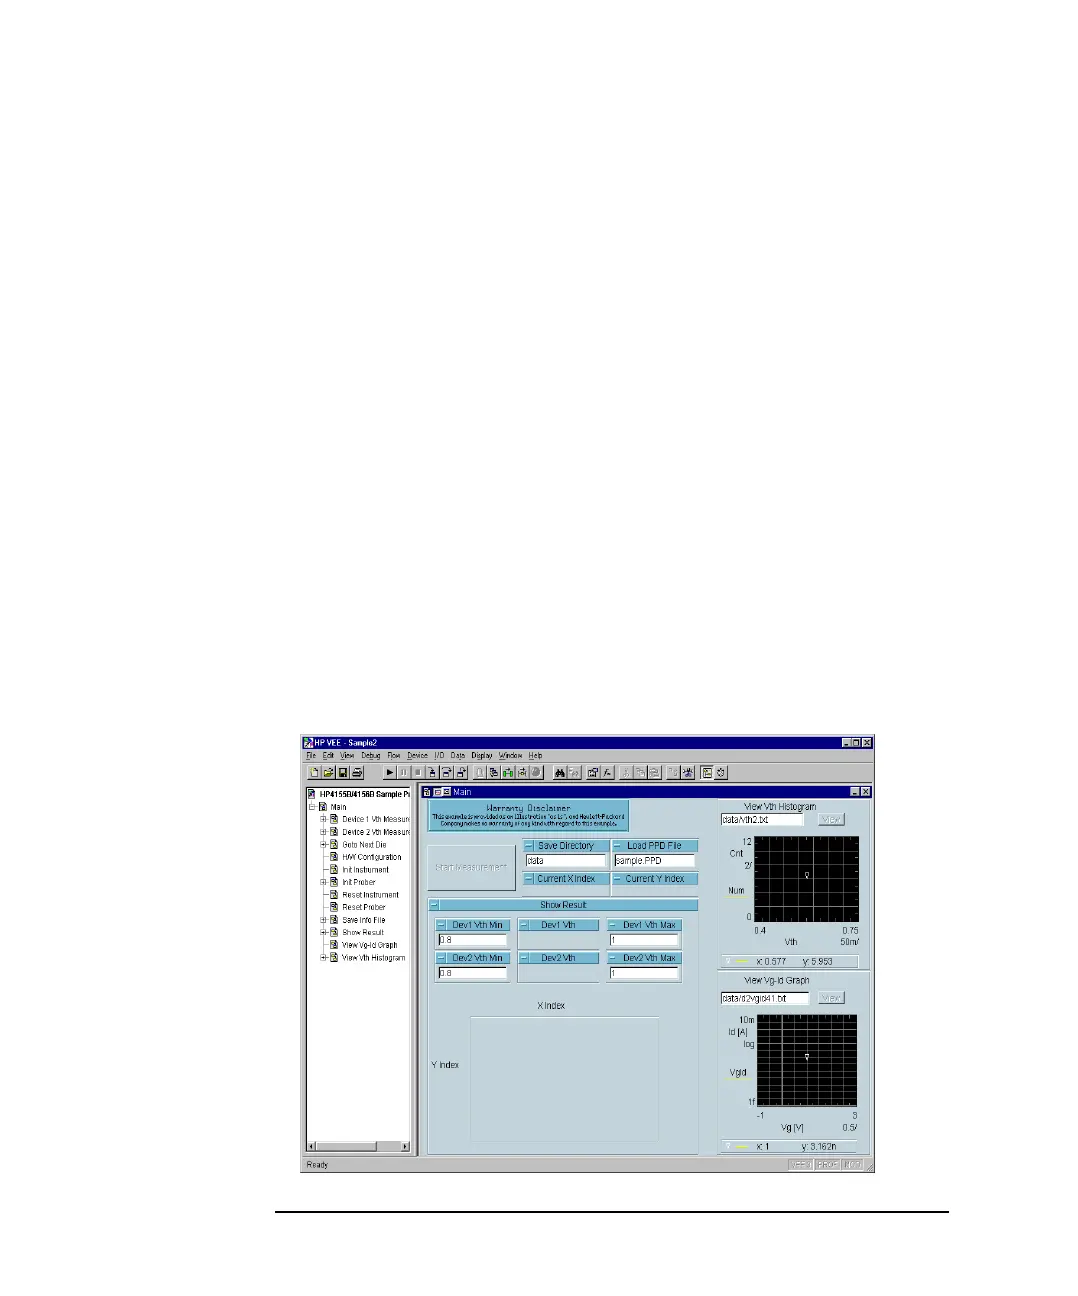
The sample2.vee program displays the following data and graph. See Figure 7-11.
Vth Displays Vth value of device 1 and 2. The data is in volts.
Histogram Displays histogram of Vth value for the device selected. Enter
the file name, then click View to display the histogram.
Vg-Id Graph Displays Id-Vg curve for the device selected. Enter the file
name, then click View to display the graph.
X, Y Index Displays wafer map of Vth value using the following
characters.
. : Both device 1 and 2 test data are within the allowable range.
F1: Device 1 test data is out of the allowable range.
F2: Device 2 test data is out of the allowable range.
F3: Both device 1 and 2 test data are out of the allowable range.
The allowable range is specified by Dev1(2) Vth Min and
Dev1(2) Vth Max input fields. Min field sets the lower limit,
and Max field sets the upper limit.
Figure 7-11 Panel Display of sample2.vee