www.agilent.com
*G7102-90200*
*G7102-90200*
G7100-90200
Edition: 01/2018 Edited in Germany
© Agilent Technologies, Inc 2018
Agilent Technologies, Inc
Hewlett-Packard-Strasse 8
76337 Waldbronn
Germany
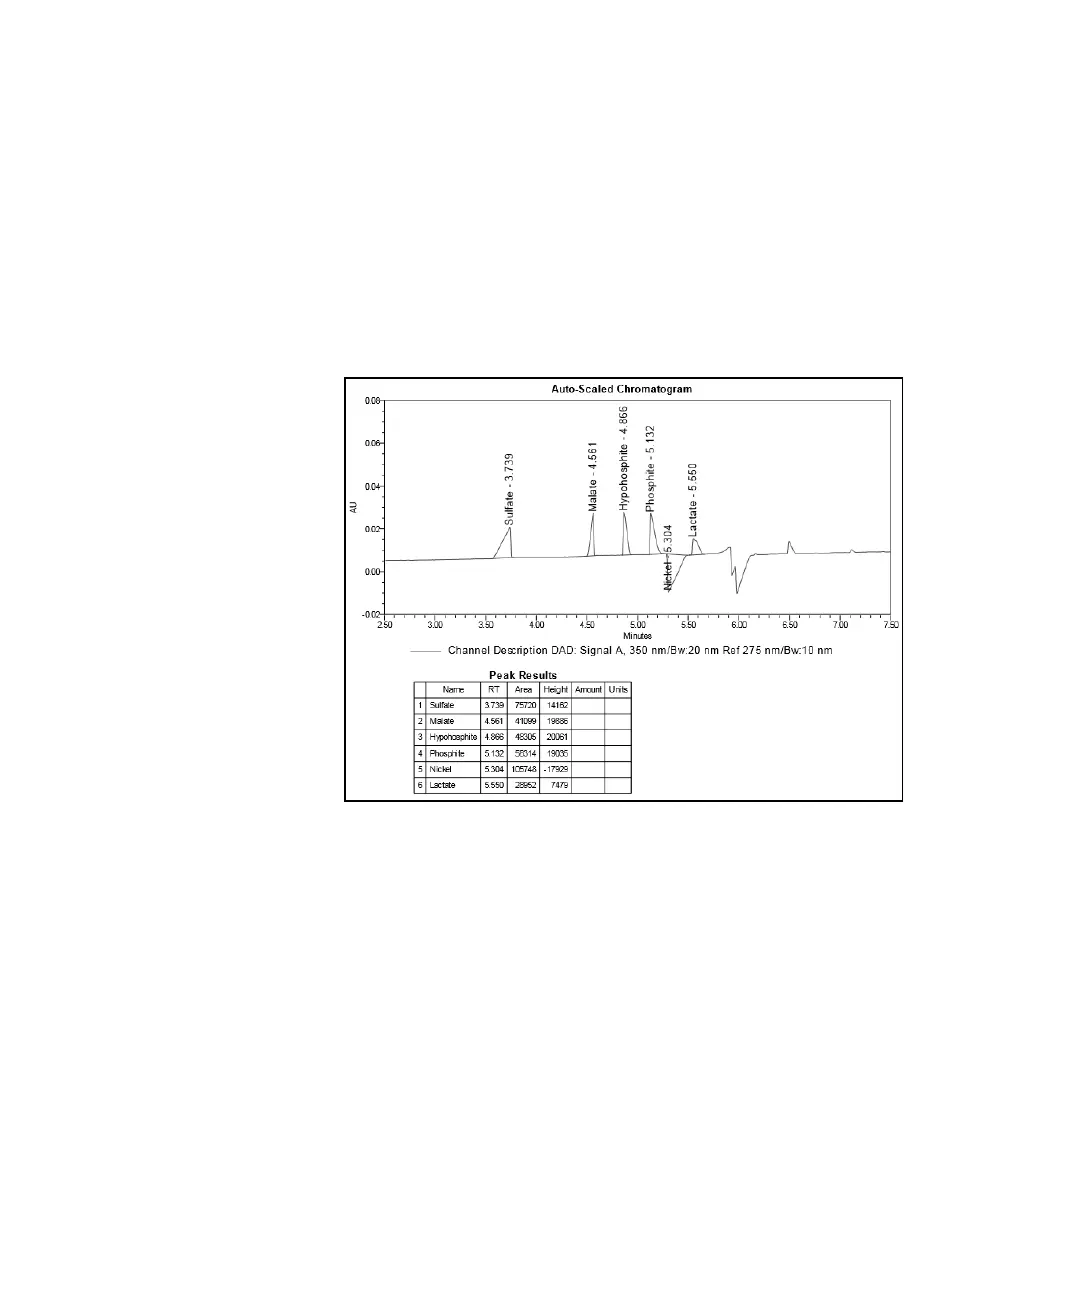
It is evident from the electropherogram in Figure 30 that the selected
wavelength values result in positive peaks for the non-UV absorbing
analytes: sulfate, malate, hypophosphite, phosphite and lactate. The
nickel-complex has its own UV intensity and results in a negative
peak. The figure also shows that the integration and evaluation of the
peak areas are possible for positive and negative peaks in the same
signal.
Figure 30 Integration and reporting of positive and negative peaks
 Loading...