For example:
19.765
GHz
(Spectrum
analyzer center
frequency)
+ 338
kHz
(Possible
value
of
calibration
constant
#18
+
20
kHz
(Value
from
second
column
of
the
table)
---------------------------------------------------------
-------------
=
19,765,358,000
Hz
(Record
this
result
in
the
last
column
of
the
table.)
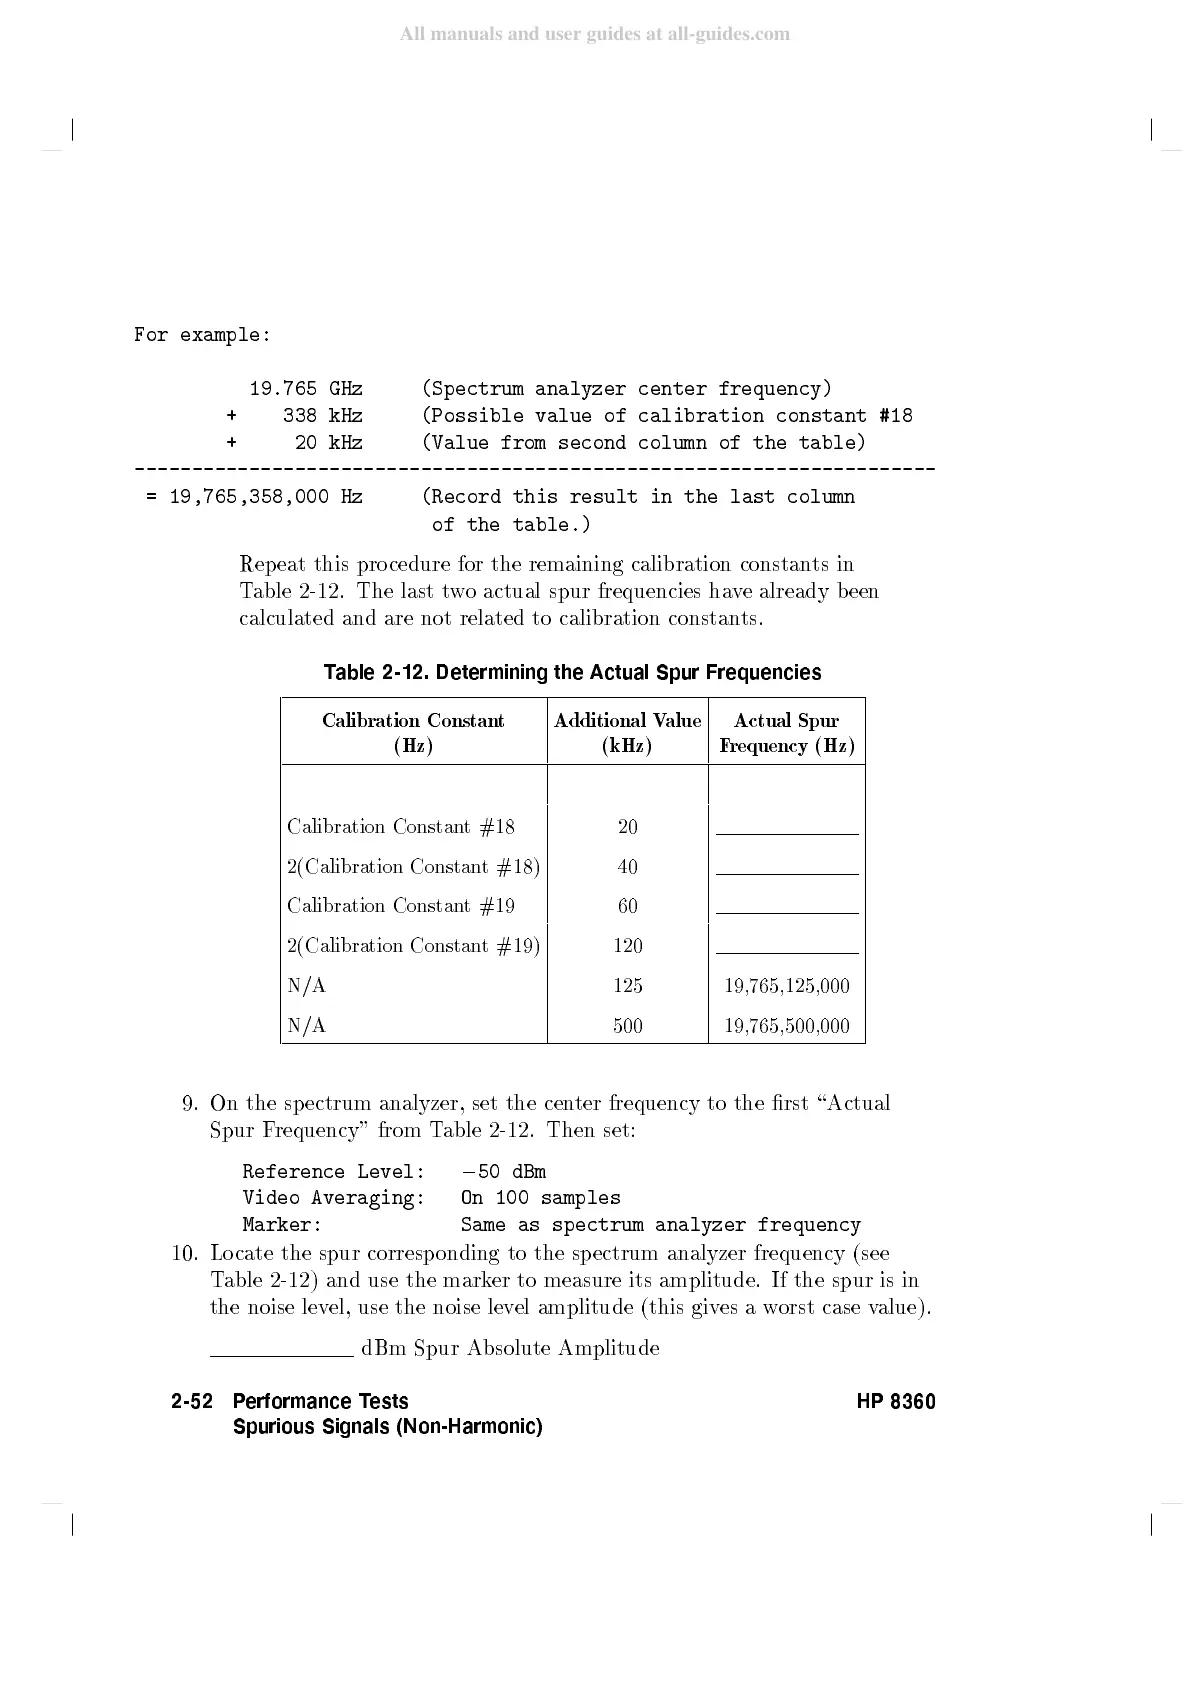
Rep
eat
this
pro
cedure
for
the
remaining
calibration
constants
in
T
able
2-12
.
The
last
t
wo
actual
spur
frequencies
ha
v
e
already
b
een
calculated
and
are
not
related
to
calibration
constan
ts.
T
able
2-12.
Determining
the
Actual
Spur
Frequencies
Calibration
Constant
(Hz)
Additional
Value
(kHz)
Actual
Spur
F
requency (Hz)
Calibration
Constan
t
#18
20
2(Calibration
Constan
t
#18)
40
Calibration
Constan
t
#19
60
2(Calibration
Constan
t
#19)
120
N/A 125 19,765,125,000
N/A 500 19,765,500,000
9. On
the sp
ectrum analyzer,
set the
center
frequency
to
the
rst
\Actual
Spur
F
requency"
from
Table
2-12
.
Then
set:
Reference Level:
0
50 dBm
Video Averaging:
On 100
samples
Marker: Same as spectrum analyzer frequency
10. Locate the spur corresp onding
to the sp ectrum analyzer frequency (see
Table 2-12 ) and use the mark
er to measure its amplitude. If the spur is in
the noise lev
el, use the noise lev
el amplitude (this
gives a w
orst case v
alue).
dBm Spur Absolute Amplitude
2-52 Performance Tests
Spurious Signals (Non-Harmonic)
HP 8360