EasyManuals Logo

Agilent Technologies 8753ES User Manual

Agilent Technologies 8753ES
479 pages
To Next Page IconTo Next Page
To Previous Page IconTo Previous Page
Page #252 background imageLoading...
Page #252 background image
4-28
Printing, Plotting, and Saving Measurement Results
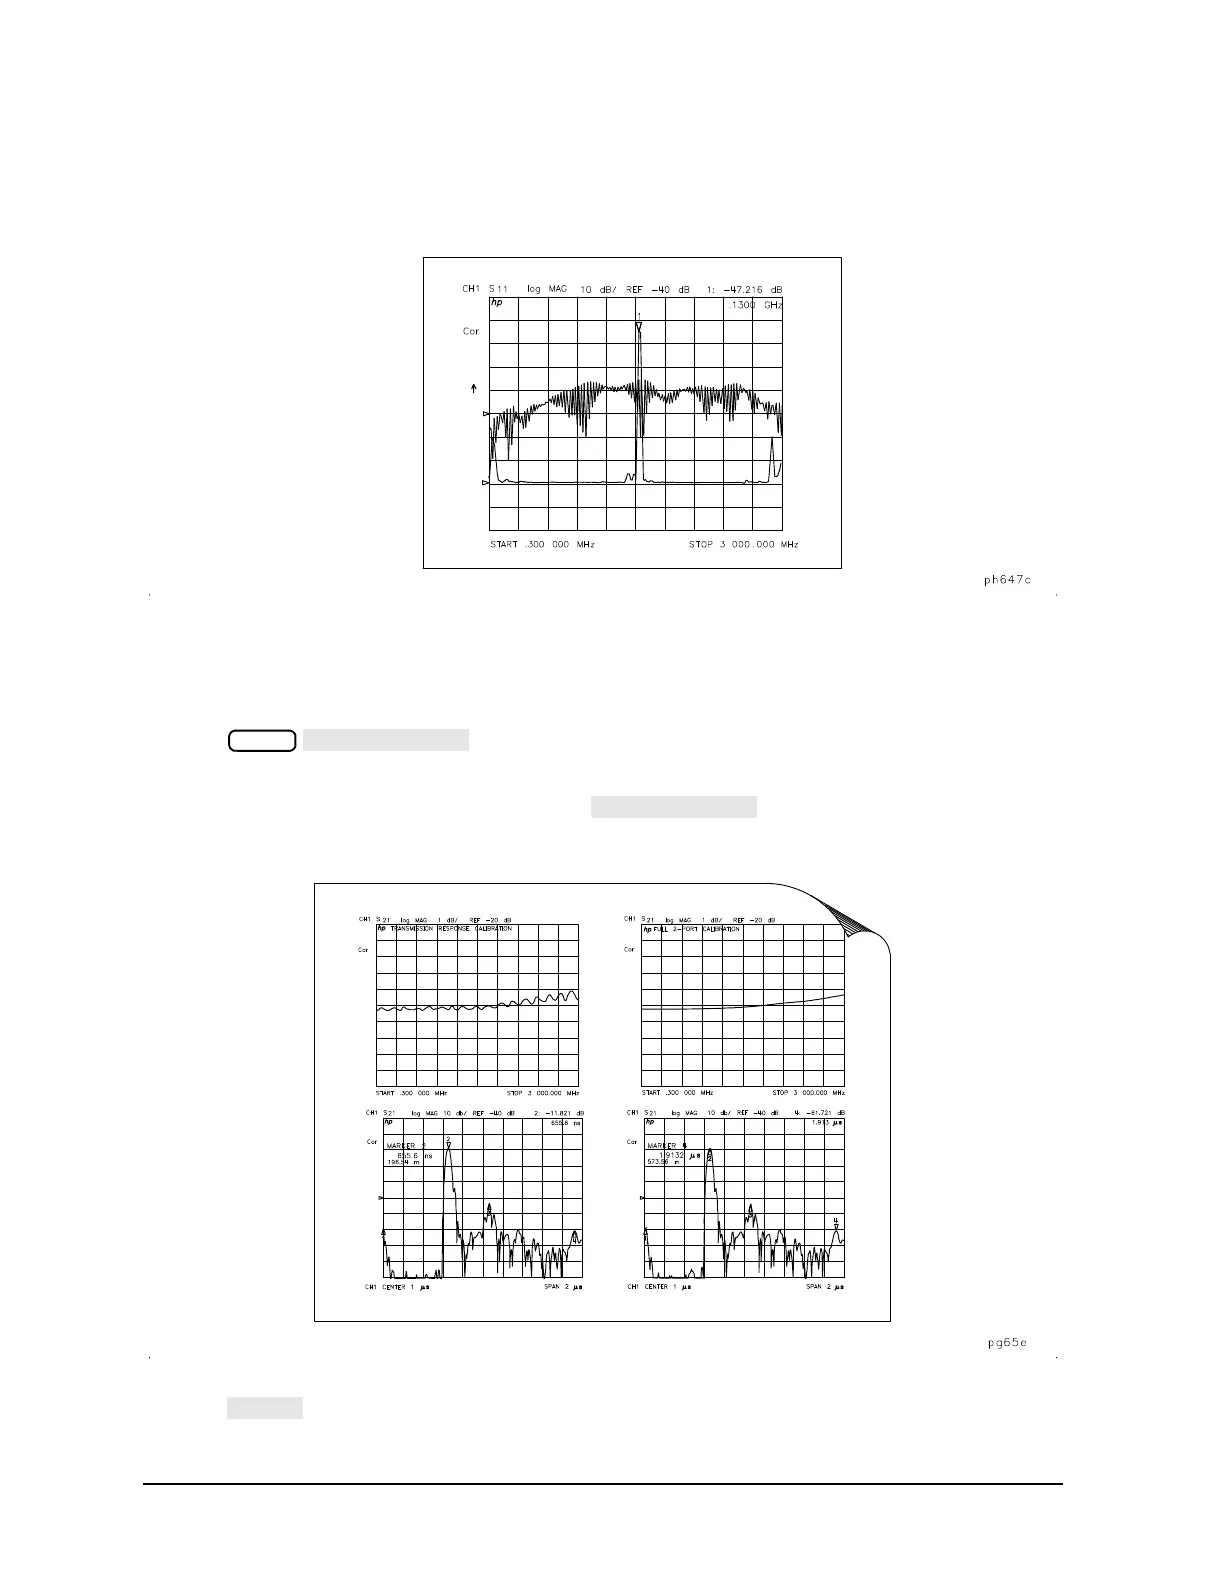
Plotting Multiple Measurements Per Page from Disk
Figure 4-10 shows plots for both the frequency and time domain responses of the same device.
Figure 4-10 Plotting Two Files on the Same Page
To Plot Measurements in Page Quadrants
1. Define the plot, as explained in "Defining a Plot Function" on page 4-13.
2. Press .
3. Choose the quadrant where you want your displayed measurement to appear on the hardcopy. The
selected quadrant appears in the brackets under
.
Figure 4-11 Plot Quadrants
4. Press . The analyzer assigns the first available default filename for the selected quadrant. For
Copy
SEL QUAD [ ]
SEL QUAD [ ]
PLOT

Table of Contents

Other manuals for Agilent Technologies 8753ES

Questions and Answers:

Question and Answer IconNeed help?

Do you have a question about the Agilent Technologies 8753ES and is the answer not in the manual?

Agilent Technologies 8753ES Specifications

General IconGeneral
BrandAgilent Technologies
Model8753ES
CategoryMeasuring Instruments
LanguageEnglish

Related product manuals