1-42
Making Measurements
Using Markers
analyzer calculates the statistics for the entire trace.
1. Move marker 1 to any point that you want to reference:
• Turn the front panel knob.
OR
• Enter the frequency value on the numeric keypad.
2. Press to make marker 1 a reference marker.
3. Press and move marker 2 to any position that you want to measure in reference to
marker 1.
4. Press to calculate and view the mean,
standard deviation, and peak-to-peak values of the section of the measurement data between the active
marker and the delta reference marker.
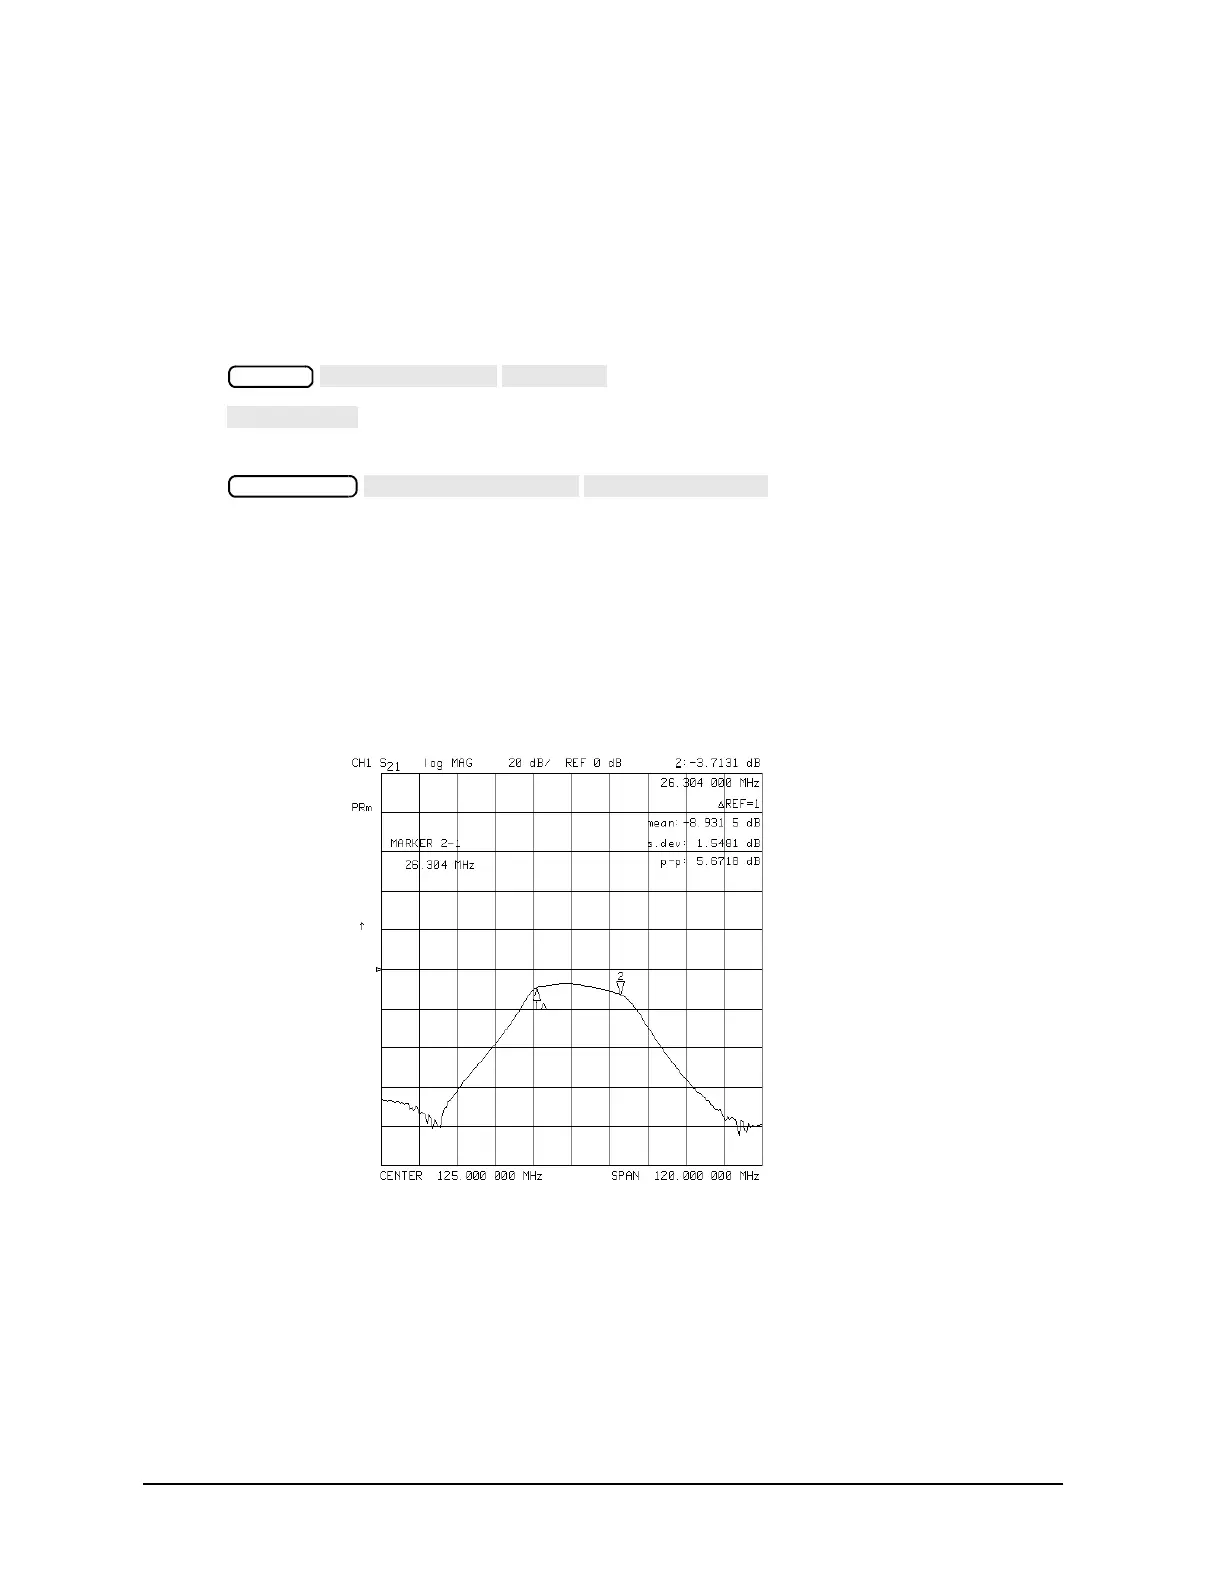
An application for this feature is to find the peak-to-peak value of passband ripple without searching
separately for the maximum and minimum values.
If you are viewing a measurement in the polar or Smith Chart format, the analyzer calculates the
statistics using the first value of the complex pair (magnitude, real part, resistance, or conductance).
Figure 1-32 Example Statistics of Measurement Data