20
A FAILURE indication will appear in the small box in the right bottom when the signal values are insufficient and
an OK indication when the signal values are appropriate.
Note: You can jump fast to the other menus related to the frequency you have measured with the SPECTRUM
box at the very bottom. Detailed information will be provided in the following pages with regards to the Spectrum
Analysis features.
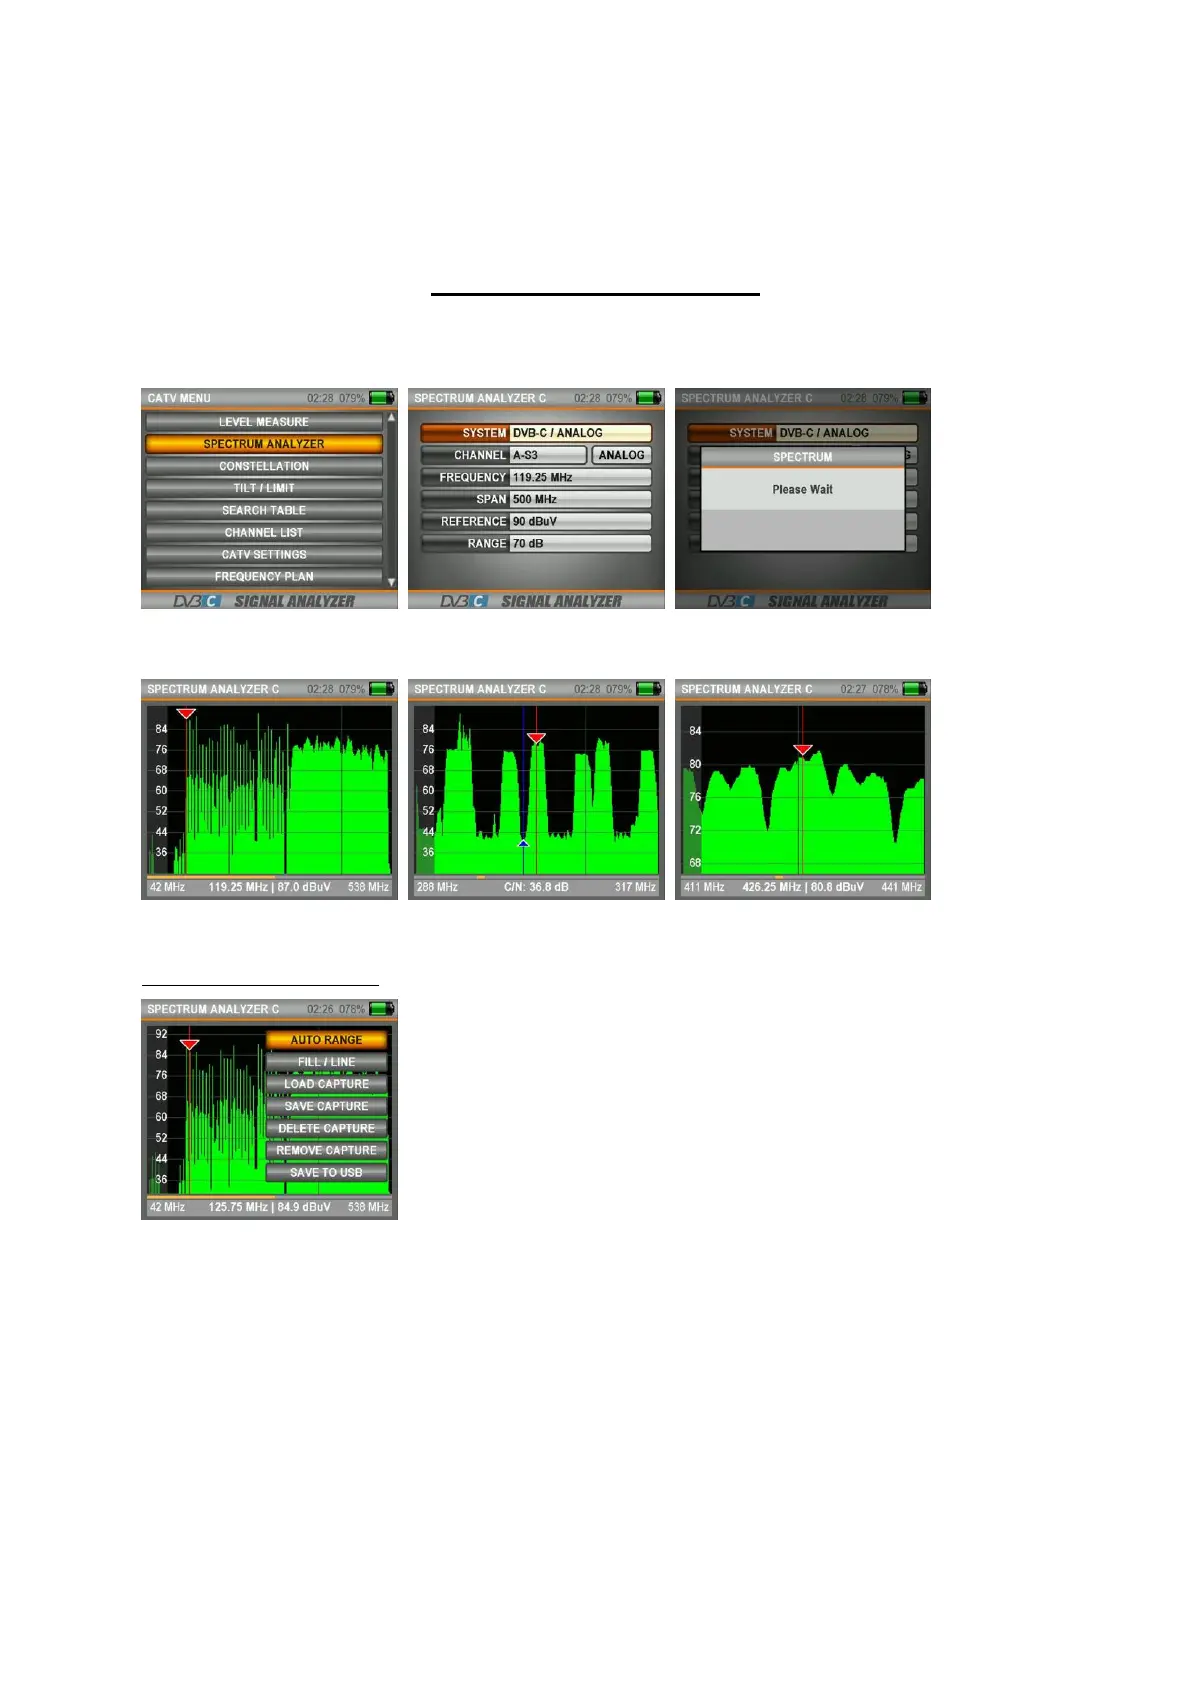
SPECTRUM ANALYSER MENU:
Press on the MENU button and go to the CATV MENU screen and start performing a measurement by selecting
the SPECTRUM ANALYSER box. The device will display all ANALOGUE and DIGITAL carrier signals determined to
be within the span (the frequency range) when it is set over to the SPECTRUM ANALYSIS measurement mode.
Please select the ANALOGUE or DIGITAL frequency, the WIDTH (the frequency area), the REFERENCE (upper
measurement point) and the RANGE (the range between the upper and lower measurement points).
The ANALOGUE and digital signals can be displayed in different forms on the spectrum screen depending on the
band widths and the strength levels.
Clicking on the MENU button:
The screen above will appear when we click on the MENU button while you are in the Spectrum screen.
AUTO RANGE: Determines the top and lowest levels of the signal levels and establishes the screen indicator range
according to this.
LINE/FILLED: Shows the spectrum image in lines or filled.
SPECTRUM CAPTURE: Records the spectrum image on the screen and you can call this lined visualization at a
later time and compare it with the last measurement you have performed.
SAVE TO USB: You can record the image data on the spectrum screen on your USB memory card.
 Loading...