Preliminary Technical Data UG-1828
Rev. PrC | Page 313 of 338
Figure 298. Monitor Mode Window
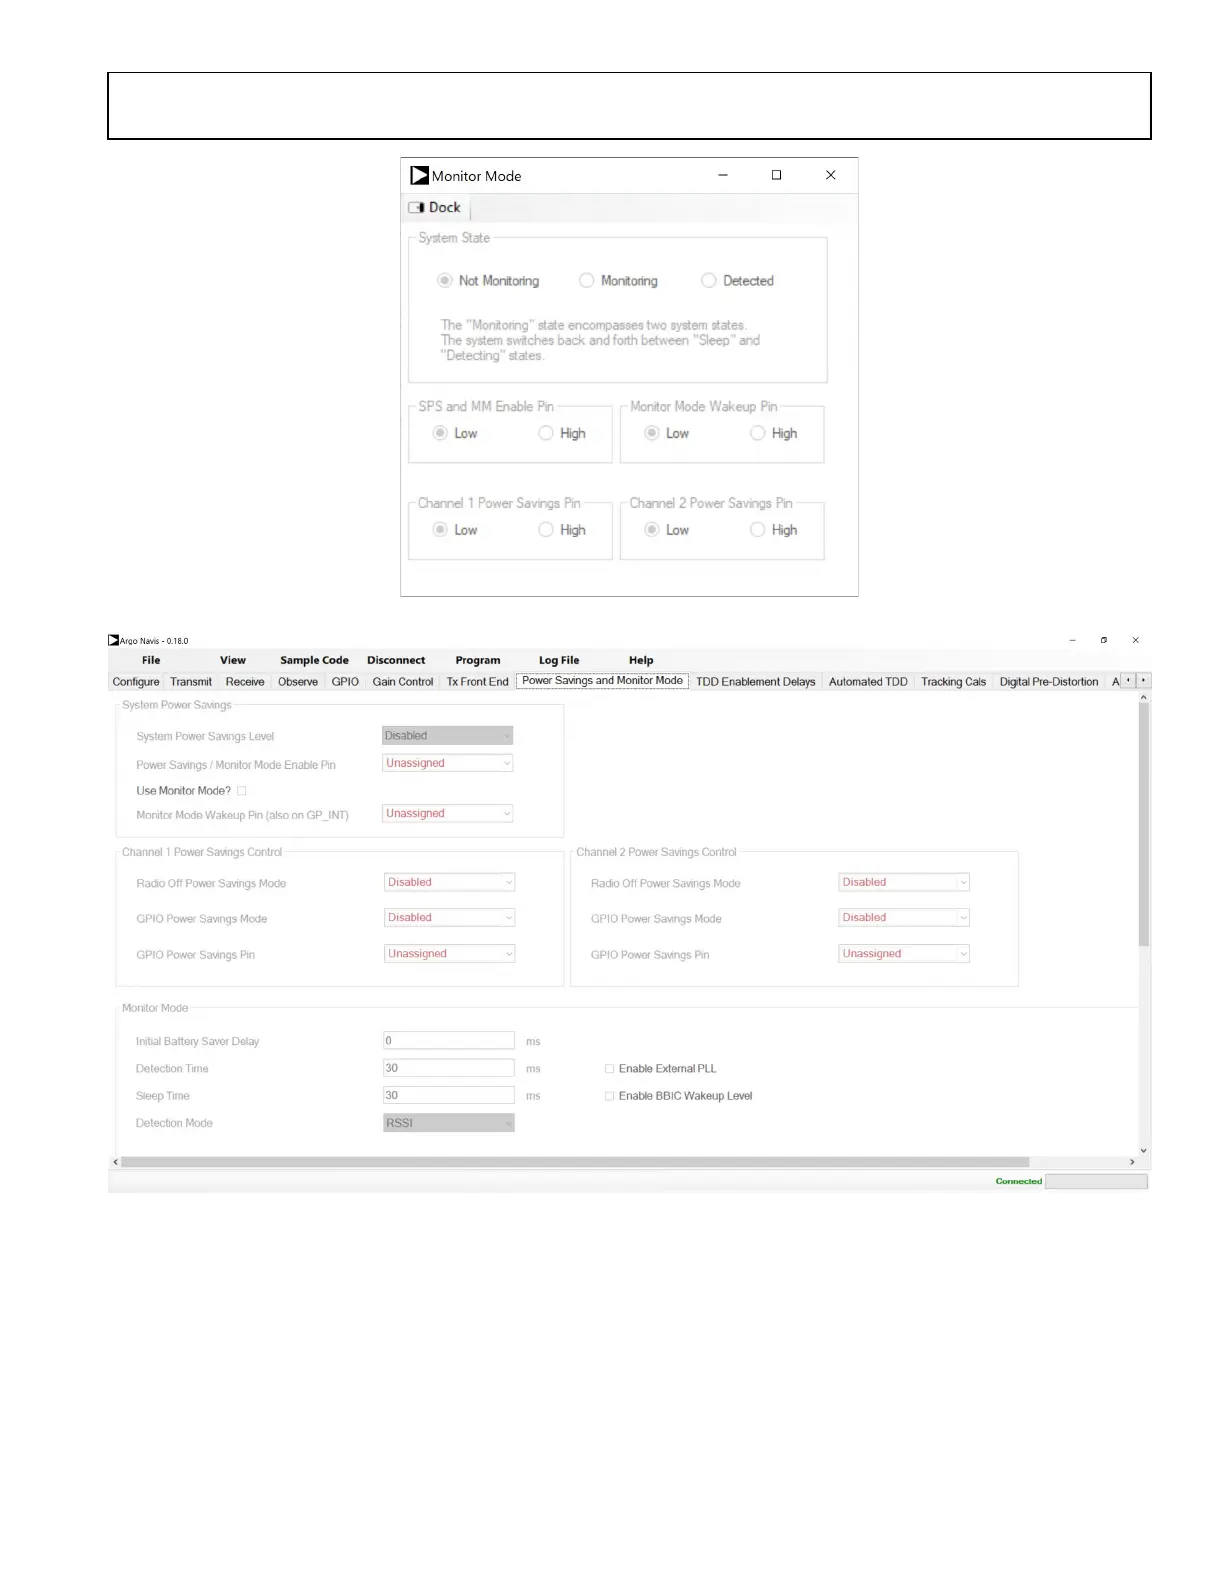
Figure 299. Power Savings and Monitor Mode
Transmitter Operation
Selecting the Transmit tab opens a page as shown in Figure 300. The upper plot displays the FFT of the digital data and the lower plot
shows its time domain waveform. When multiple Tx outputs are enabled, the user can select desired data to be displayed in the Spectrum
plot using the checkboxes below the plot.
Once the Transmit tab is open, the user can:
• Check the RF Tx Carrier frequency in MHz,
• Change Tx attenuation level in 0.05dB steps
• Continuous Transfer is selected by default and will repeat the chose Tx signal on loop. To transmit just once this can be unselected.
 Loading...