Preliminary Technical Data UG-1828
Rev. PrC | Page 315 of 338
Receiver Operation
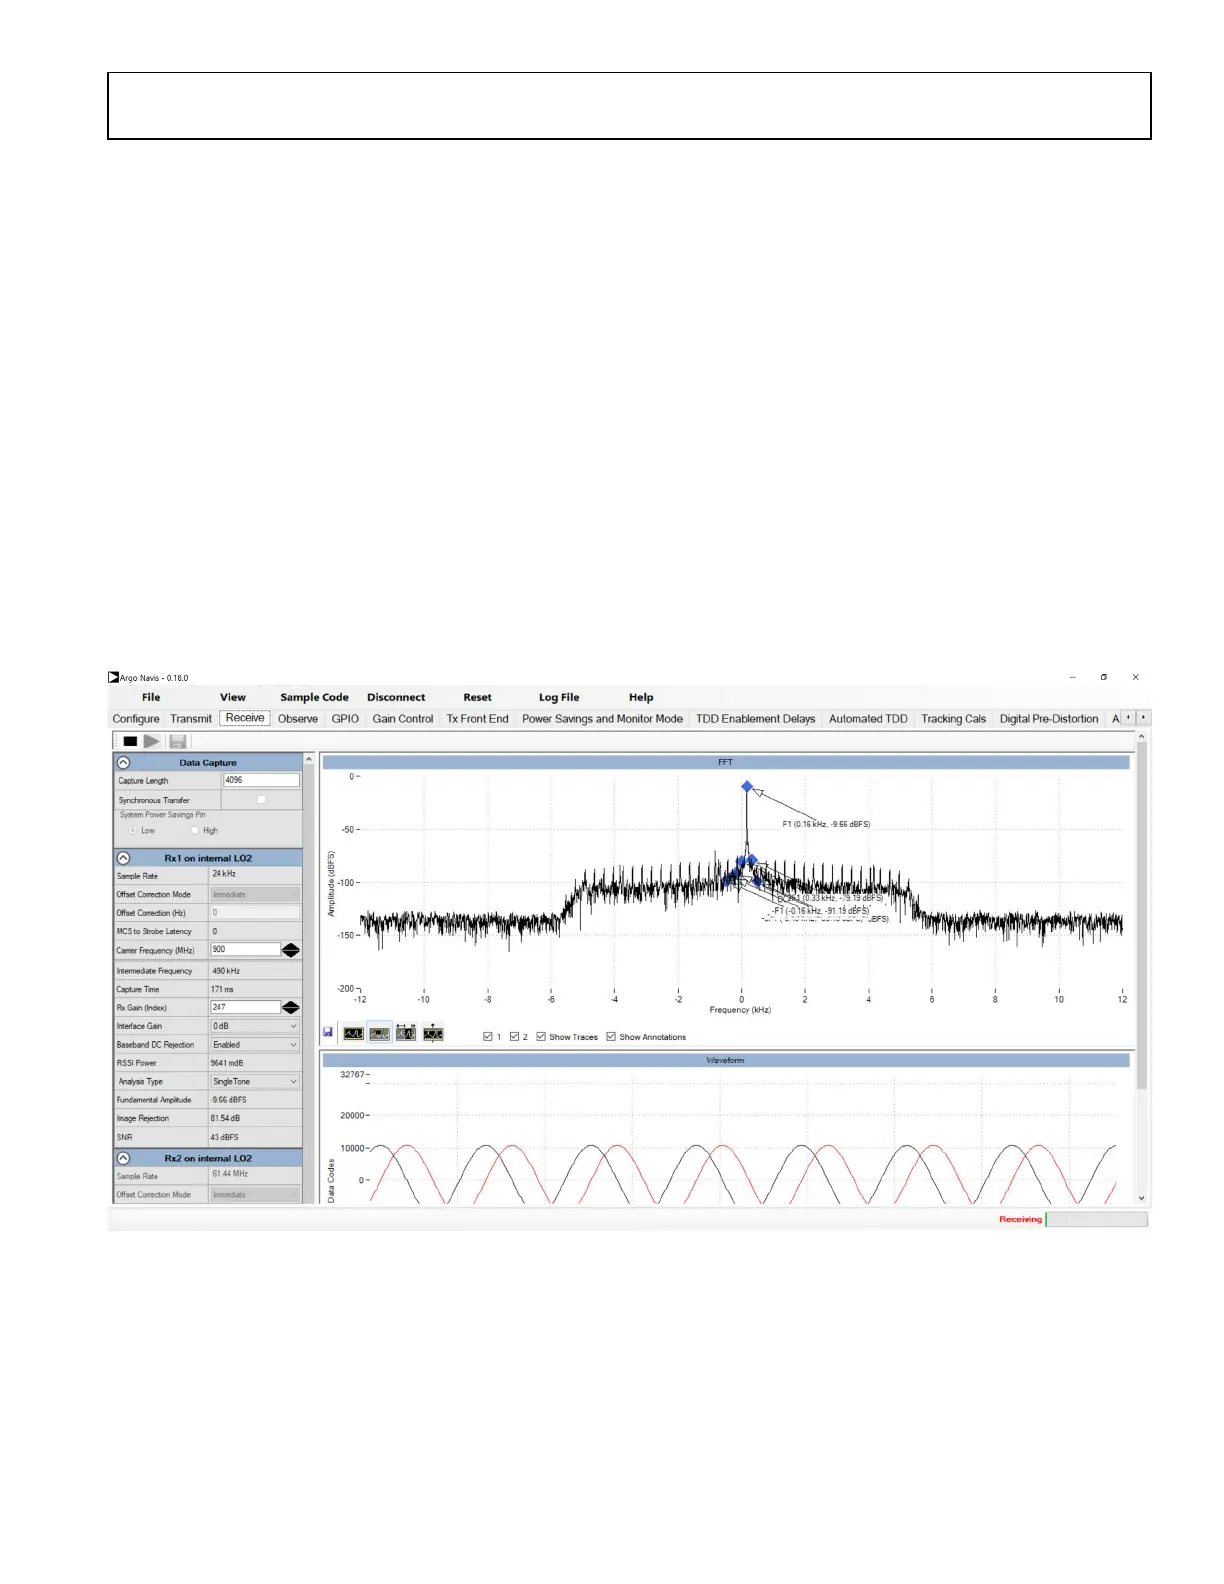
The Receive tab opens a window as shown in Figure 301. The upper plot displays the FFT of the received input data and the lower plot
shows its time domain waveform. When multiple Rx inputs are enabled, the user can select the desired data to be displayed in the
Spectrum plot using the checkboxes below the plot.
In TDD operation, Rx data is displayed only when Rx enabled is high. It will not display data gap between TDD time slots.
Once the Receive tab is open, the user can:
• Check the RF Rx Carrier frequency in MHz,
• Change capture length in number of samples,
• Change Rx gain level (gain table index),
• Change Rx interface gain (in 4 steps),
• Enable/disable Baseband DC Rejection tracking calibration
• Change frequency offset in Hz
• Read back main parameters measured in received signal such as fundamental frequency, its amplitude and DC offset,
• Plot and save received data by clicking on floppy disk icon in bottom left corner.
• Save Rx captured data (specified in Capture Length window) in form of *.csv or .tsv file.
• There is an interleaving option pop-up widow displayed when saving as a .tsv file.
Pressing the play symbols enables the selected receivers and displays received data continuously until the Stop button is pressed.
Figure 301. Receive Data Tab
Frequency Deviation
If Rx frequency deviation is enabled in the configuration step, Rx input signal will be demodulated. For example if a continuous wave of
900.003 MHz is sent to the RX port with LO of 900 MHz, which means in baseband there is a tone of 3 kHz offset from LO, on the RX tab
it is expected to see a constant of 3000 in the time domain plot.
 Loading...