15
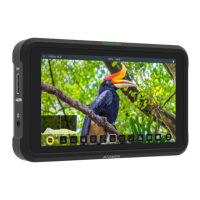
The Brightness slider directly controls the intensity of the waveform while
the opacity slider adjusts the transparency values of the waveform display
on screen. Experiment with these controls to achieve your desired
monitoring setup.
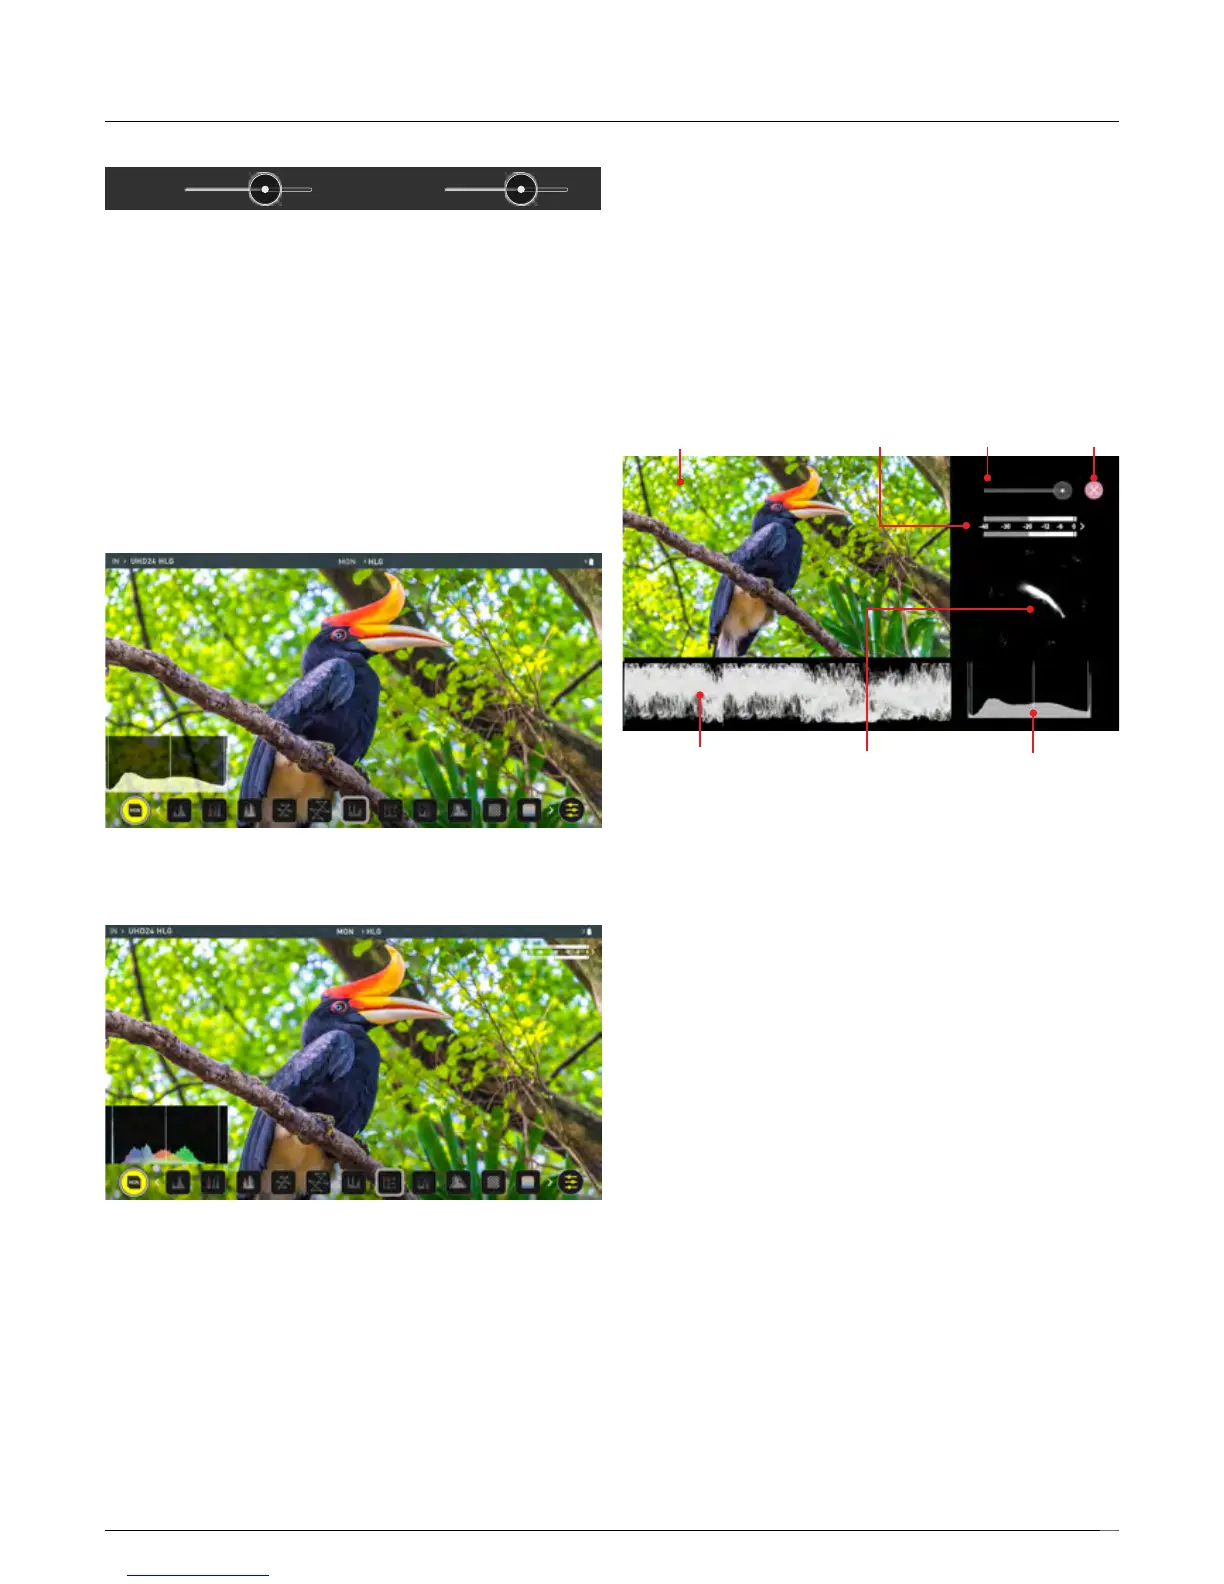
Histogram
Histogram will monitor the level of Red, Green and Blue from an input
source. The RGB channels are displayed side by side and each channel
color is shown under the corresponding waveform. This can be used to
check to the white balance. Just point the camera at something white and
the Red, Green and Blue levels should match if white balance is setup
correctly on the camera.
RGB Histogram
RGB Overlay monitors the level of Red, Green and Blue from an input.
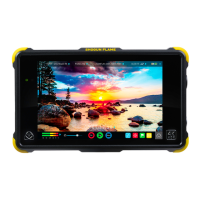
Analysis
The Analysis feature allows you to see Waveforms, Histograms and
Vectorscopes simultaneously whilst viewing the image. Each of the displays
can be toggled to customize the Multiview to suit your preferences. Toggle
Luma Waveform with RGB Parade and RGB Overlay. Toggle Histogram and
RGB Histogram for your desired settings, and Toggle Vectorscope and
Vectorscope Zoom to accurately check your white balance. Analysis mode
also allows you control over the brightness of the waveform and
vectorscope displays, while constantly displaying the subject. Instant control
atyourngertips.
Brightness CloseImage Audio
Histogram OR
RGB Histogram
Luma Waveform OR
RGB Parade
Vectorscope OR
Vectorscope Zoom
BrightnessOpacity
5. Using the Shinobi