microLAN b.v. BACTcontrol – User Manual – V0.4.4 Page 39 of 59
7.9 RESULTS
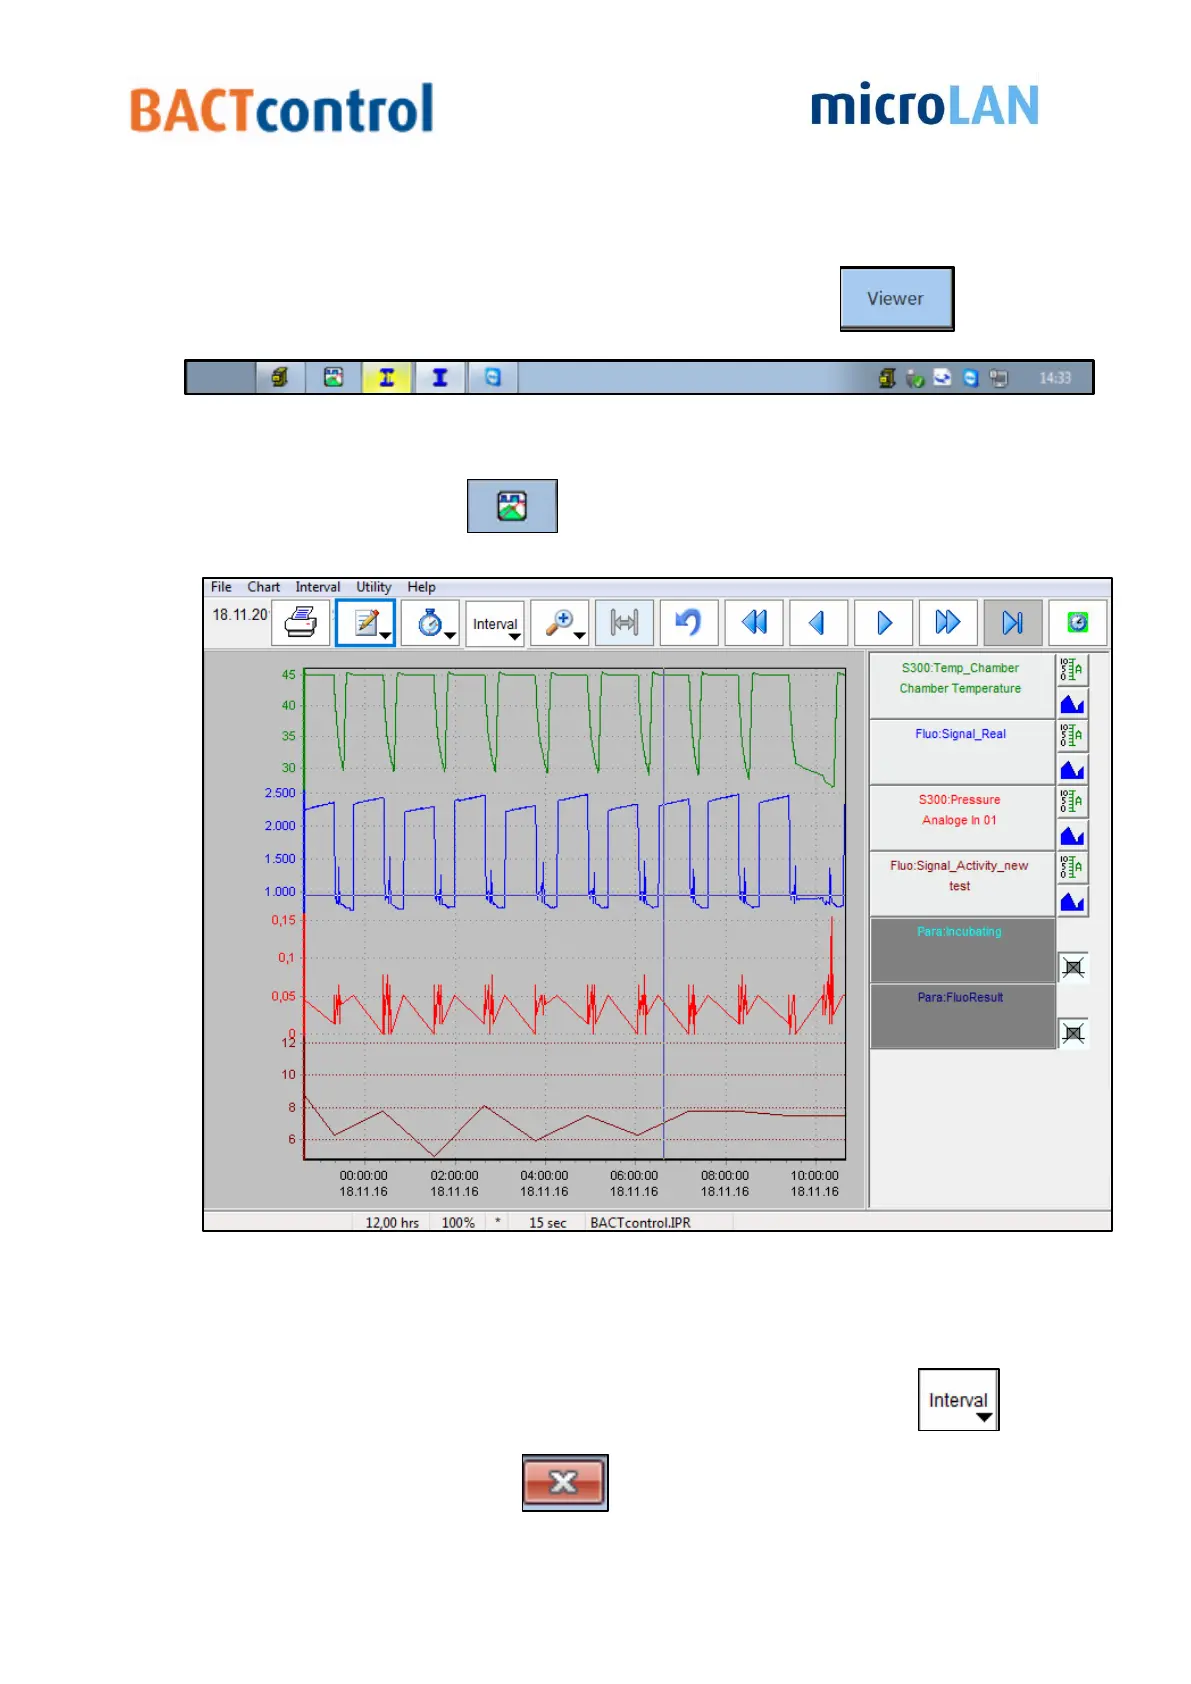
The results of the last measurements can be displayed in a graph
Go to the status bar on the bottom of the screen
(only visible when mouse is pointed on it, if not visible, click on )
Press the graph button
Now a graph appears
Figure 27 Graph data BACTcontrol
Move the cursor along the graph to see the results of a specific time on the right side
of the window.
A specific time frame vary from 1 hour to 1 month can be selected with
Close the graph by clicking on
Figure 26 Status bar BACTcontrol