Bio-Well Company
www.bio-well.com
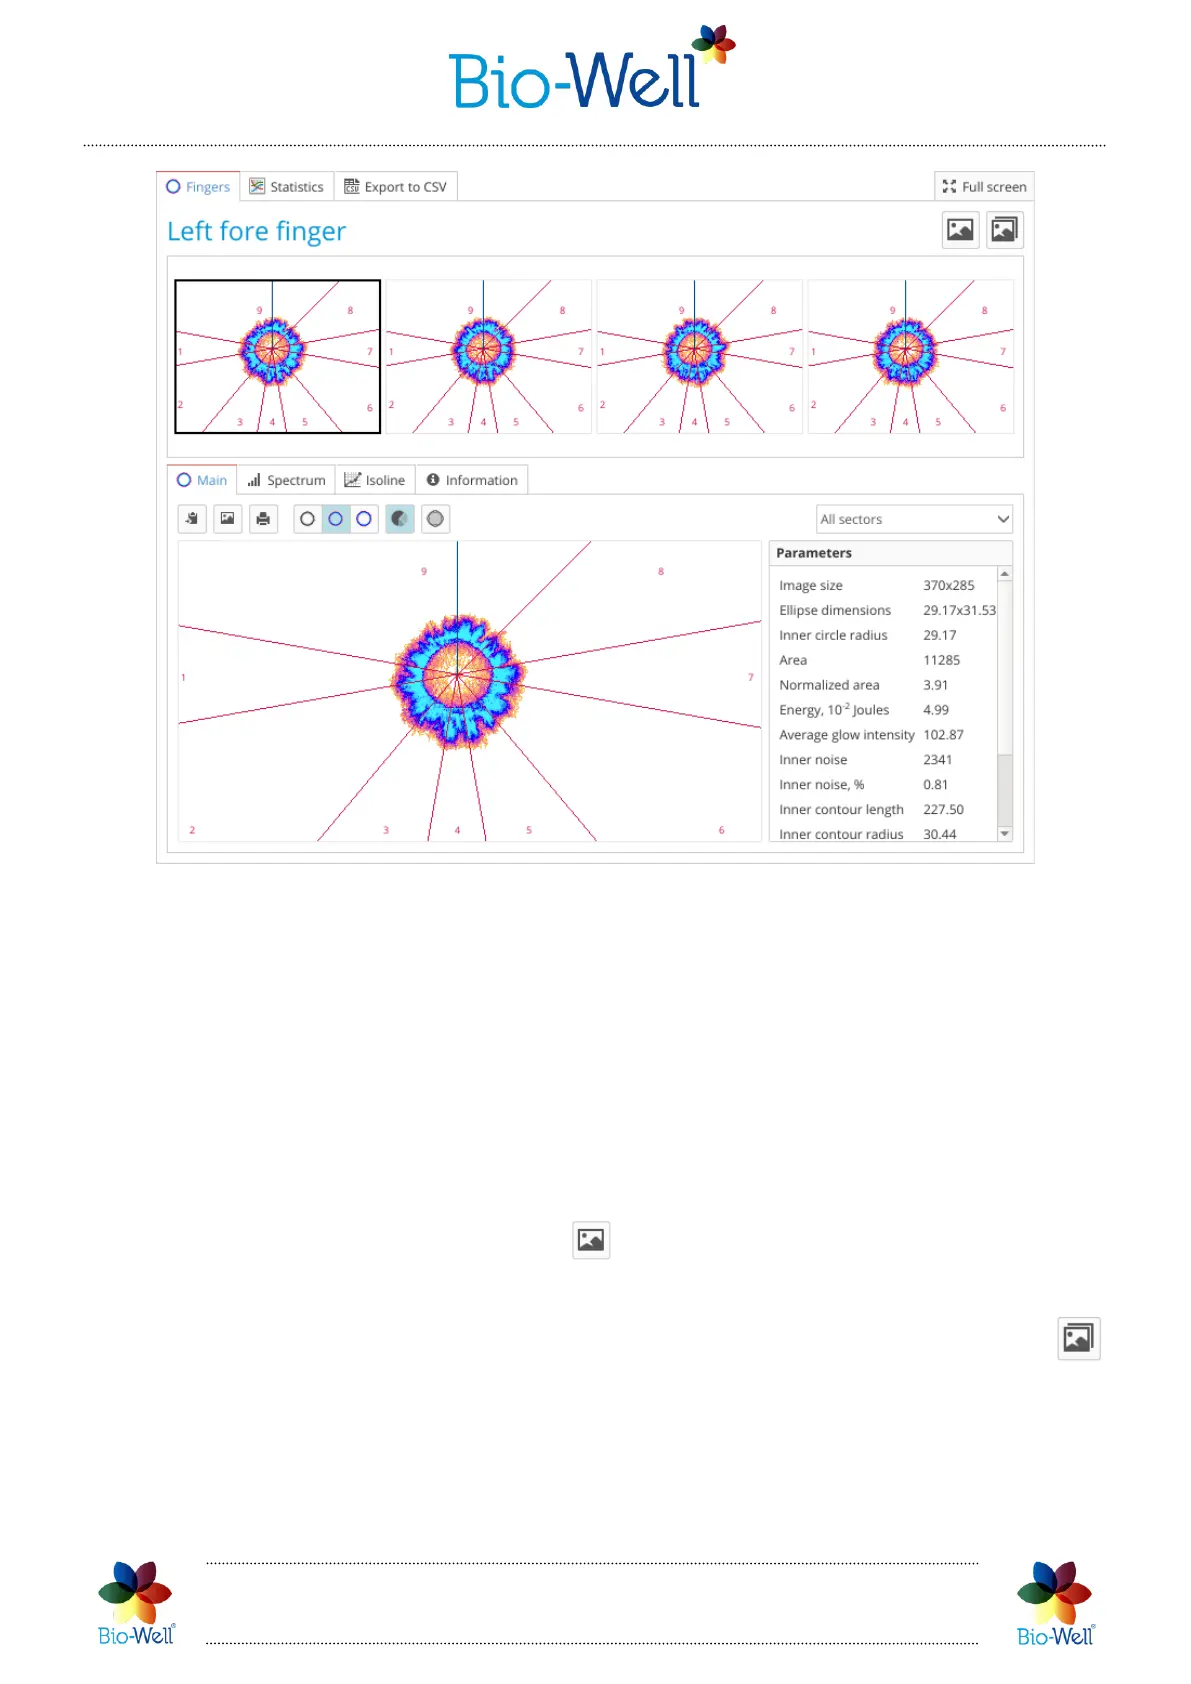
Pic. 63. “One Finger” Scan results interface.
Lower part of the interface is equal to the one of a separate finger from a “Full
Scan”. All the features are the same.
At the upper part you can click on a specific GI that you want to look at. Use the
scroll bar to access all images if you have more than 4 images in your set.
This mode is specially made for statistical analysis of some finger or specific sector
in dynamics. To access statistics click “Statistics” tab at the top of the “One Finger”
interface (pic. 64). For those parameters that have norms (Area(C) and Energy(C)) the
background of the graph will be colored according to the standard coloring grid.
If you want to save all images – click button in the top right corner and specify
the folder in which you want to save it.
It is also possible to save images and one of the graphs in one move – click the
button and specify the folder in which you want to save them.
 Loading...