Bio-Well Company
www.bio-well.com
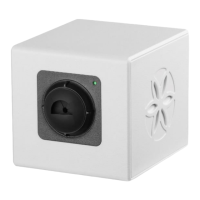
Pic. 69. Full screen mode.
X axis represents time. Each dot on the graphs represents one Glow Image taken.
Y axis represents the value of the selected parameter on the graph. You can
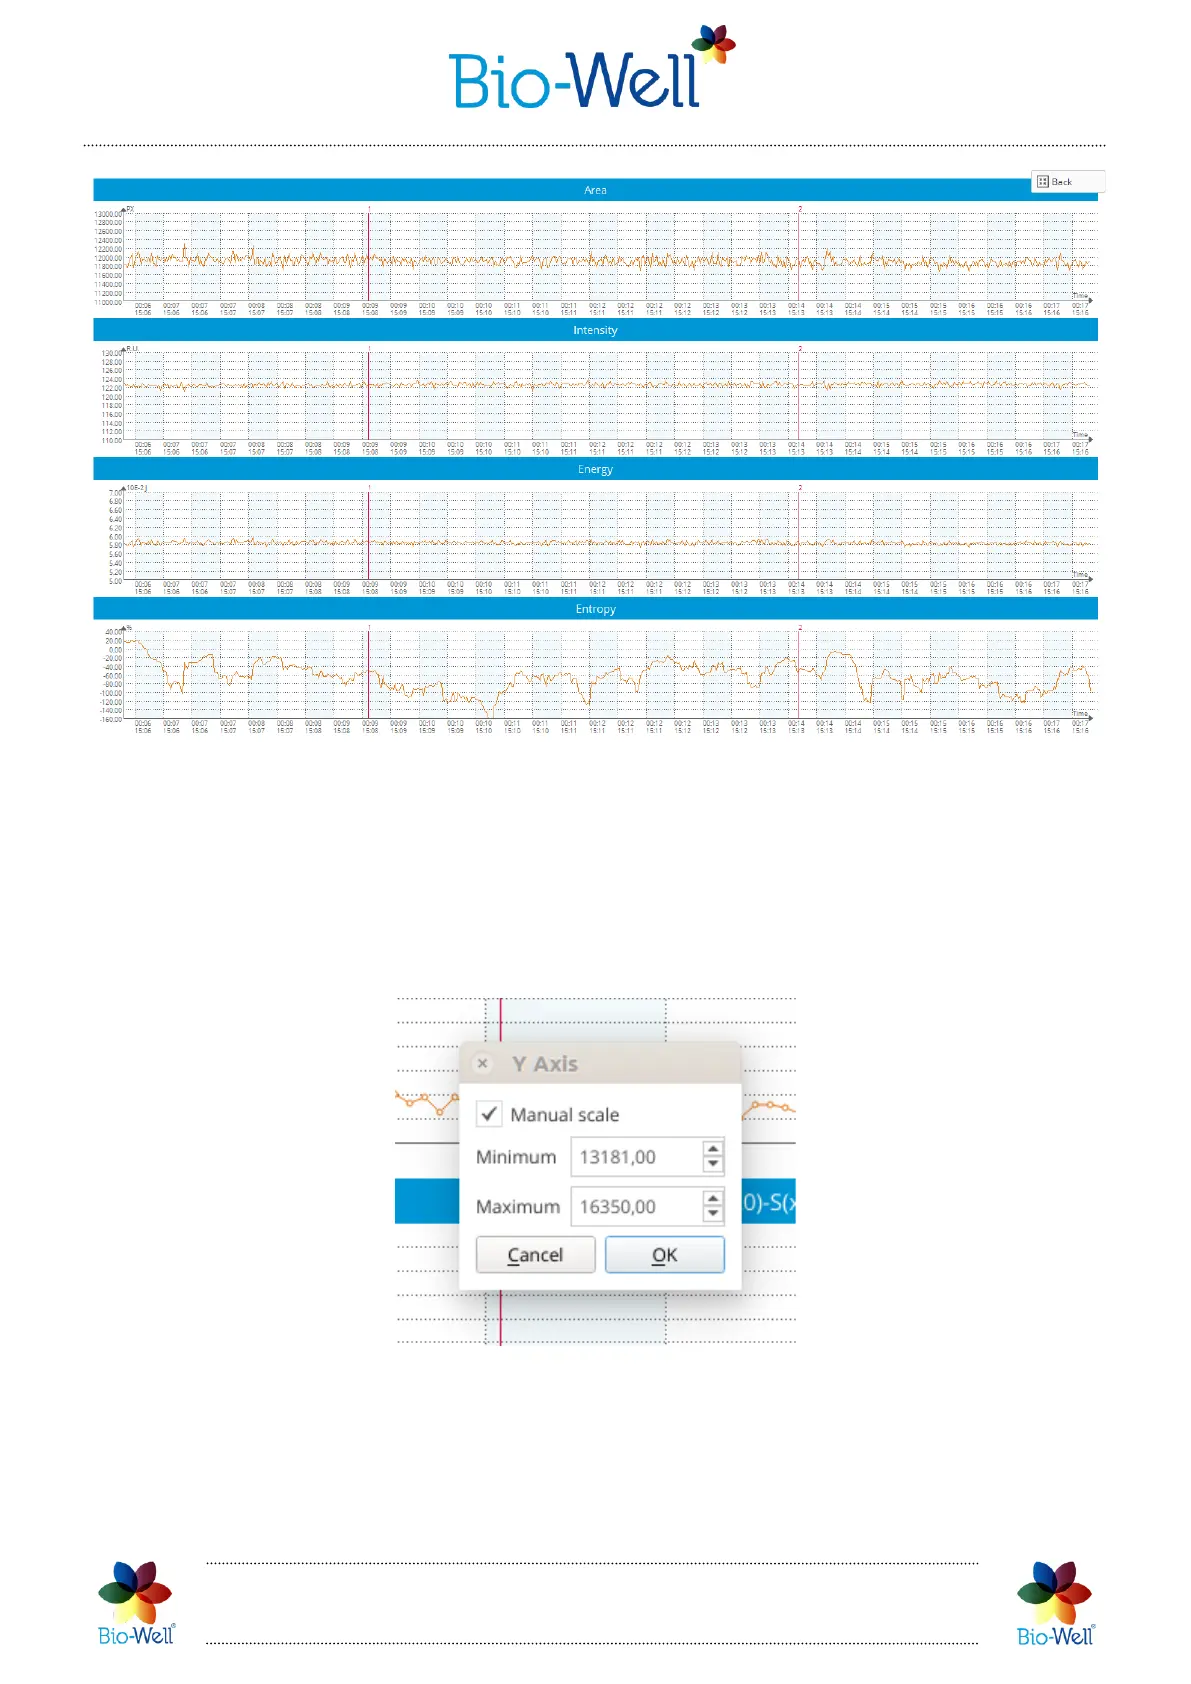
manually change the scale of the Y axis by clicking with left mouse button on the Y axis
and specifying the range that you are interested in, and clicking “OK” (see pic.70).
Pic. 70. Setting up manually scale of the Y axis on the graph.
In the bottom of the screen you can see the “Add a note” field, where you can add
any notes about this experiment.
 Loading...