Bio-Well Company
www.bio-well.com
Pic. 67. Adding labels to the experiment.
Click “View” button to change the graphs displayed on the screen. Options are:
Area, Intensity, Energy and Entropy (Entropy graph will appear after 140 GI). You can
select all of them or only those needed:
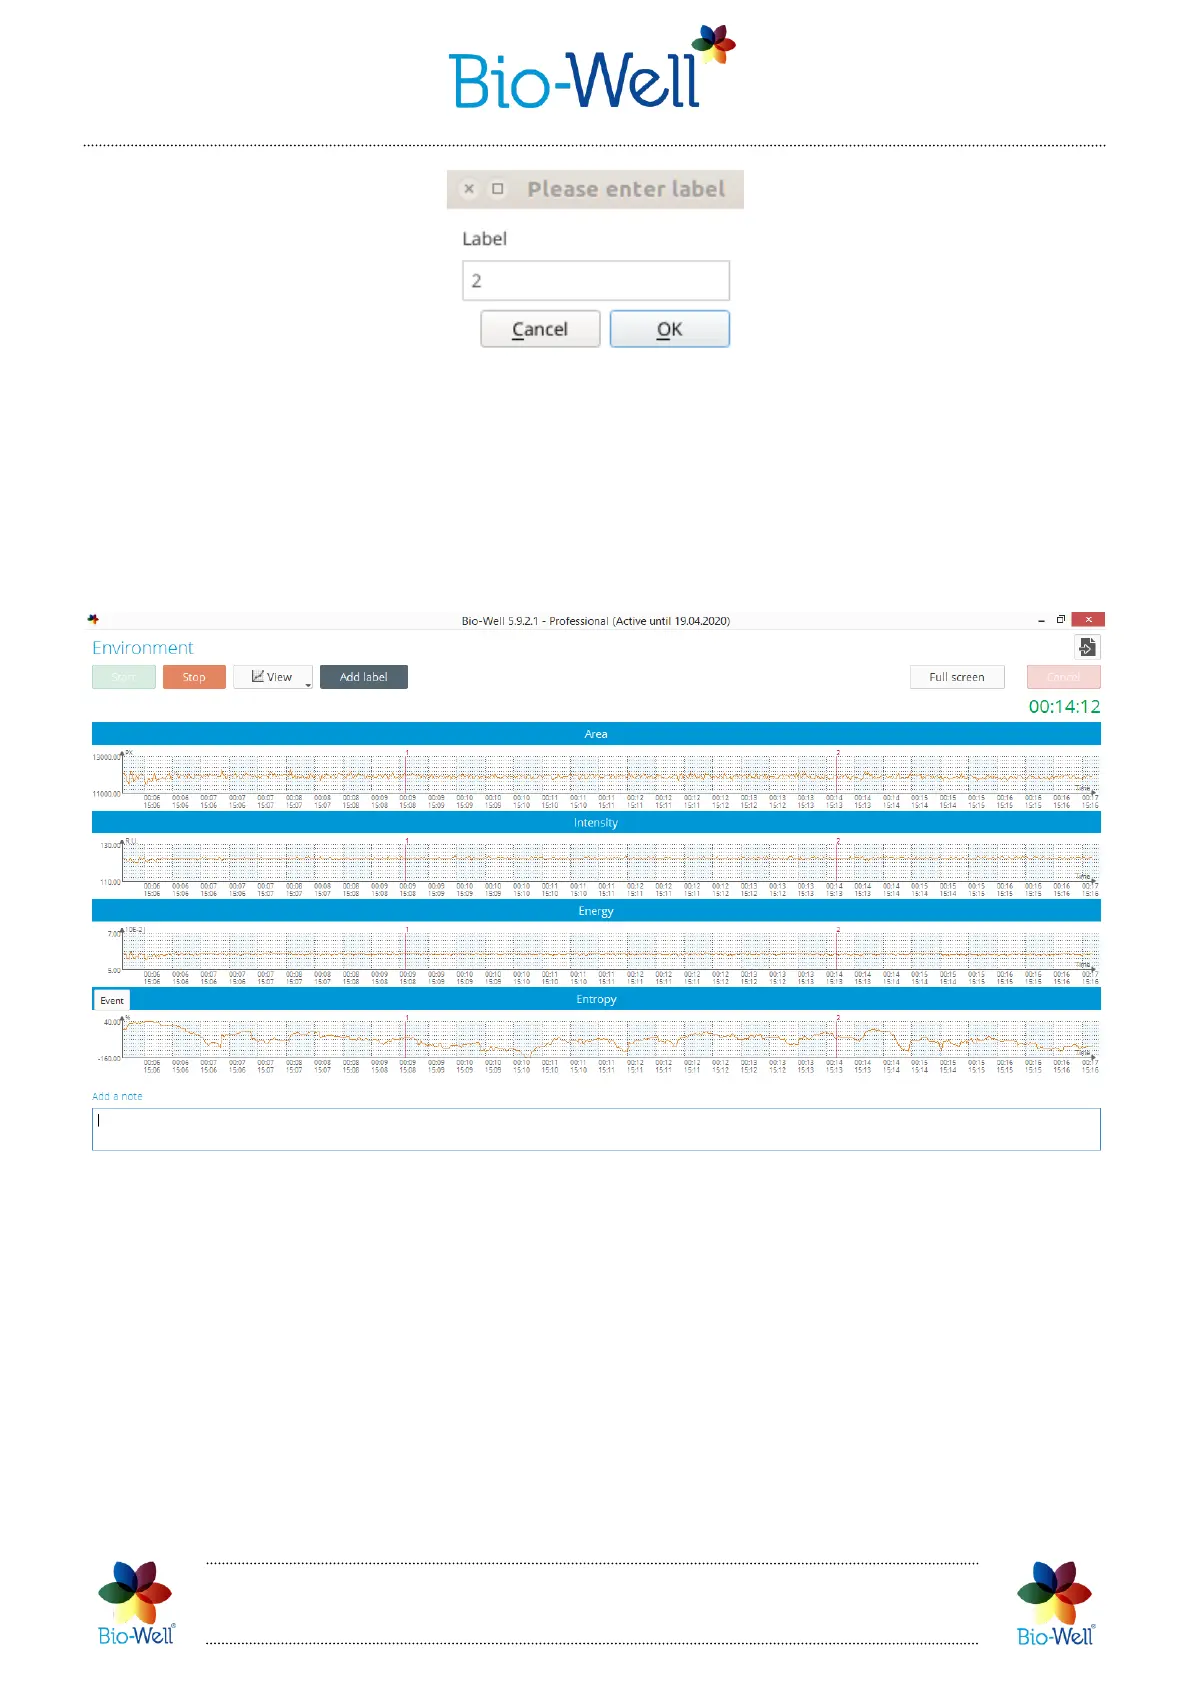
Pic. 68. Four graphs displayed during “Environment” Scan with labels “1” and “2” added.
In such a case resolution will be low and you will not be able to really analyze any
of them by your eyes. We recommend to select 1 or 2 graphs to be displayed during the
experiment. It will not affect the final result – anyway all 5 parameters will be
calculated for the whole experiment.
Added labels will be displayed on the graphs as red lines.
You can switch the “Full screen” mode by clicking such button at the top right
corner of the screen (pic. 69).
 Loading...