Bio-Well Company
www.bio-well.com
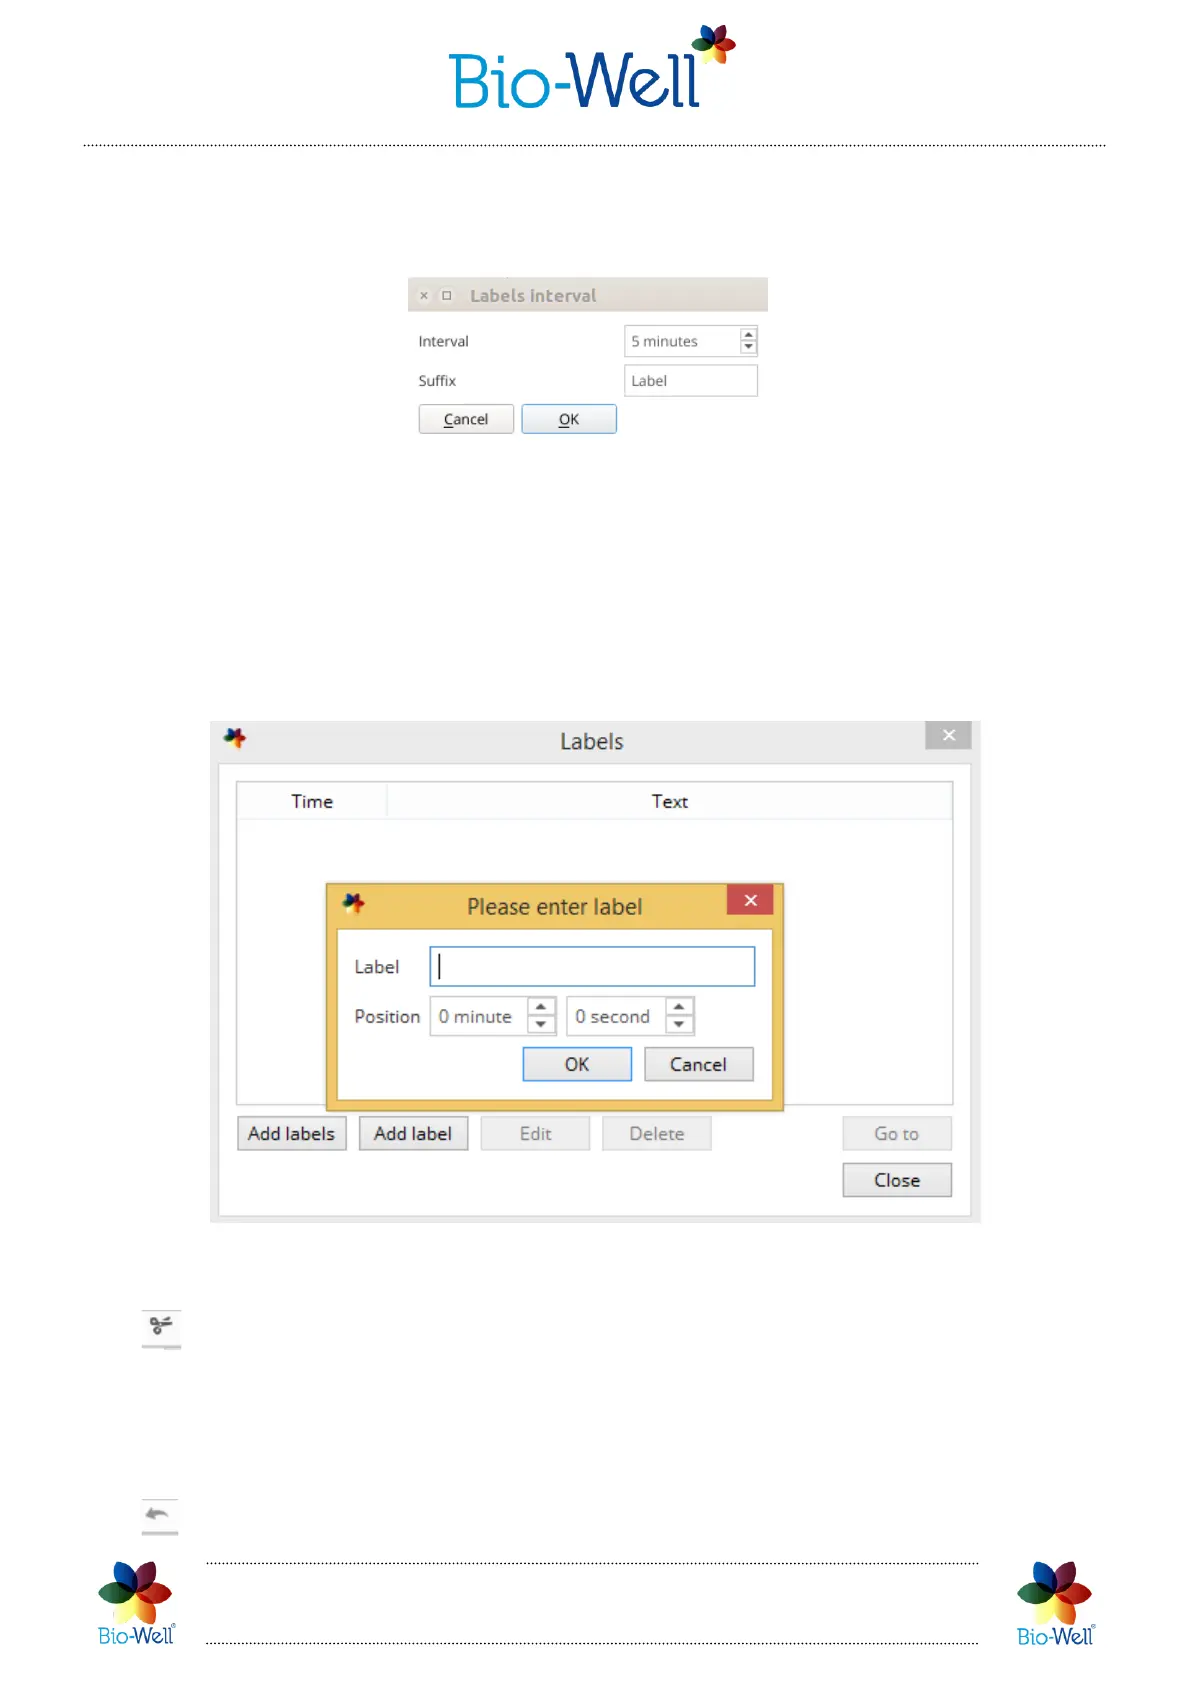
Here you can add, edit names and delete labels from the list. “Go to” button will
show on the screen the part of the graph with the selected label. Adding labels can be
done automatically and manually.
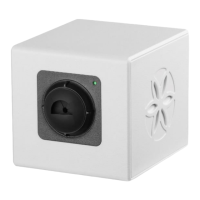
Pic. 72. Automatic adding of the labels.
You can specify interval (from 1 minute till 999 minutes) and suffix of the labels
and click “OK” to automatically add them. In the example above program will add labels
every 5 minutes with names “Label1”, “Label2”, “Label3”, etc. Also you can add labels
one by one manually: click “Add label” button, input the name of the label and specify
exact time from the start of the experiment (pic. 73).
Pic. 73. Manually adding labels to the experiment.
- click to cut one image (dot on the graph) or series of images from the
experiment. Click with the right mouse button on any dot to select it (it will be marked
with the green vertical line) or click and hold the right mouse button and then move
the mouse cursor to select a range of images (dots) that you want to cut from the graph
(the diapason will be colored in green).
- click this button to undo last change that you have made.
 Loading...