Bio-Well Company
www.bio-well.com
- click this button once you are ready with all the rest of the features
and ready to calculate the statistics – a new window will be opened.
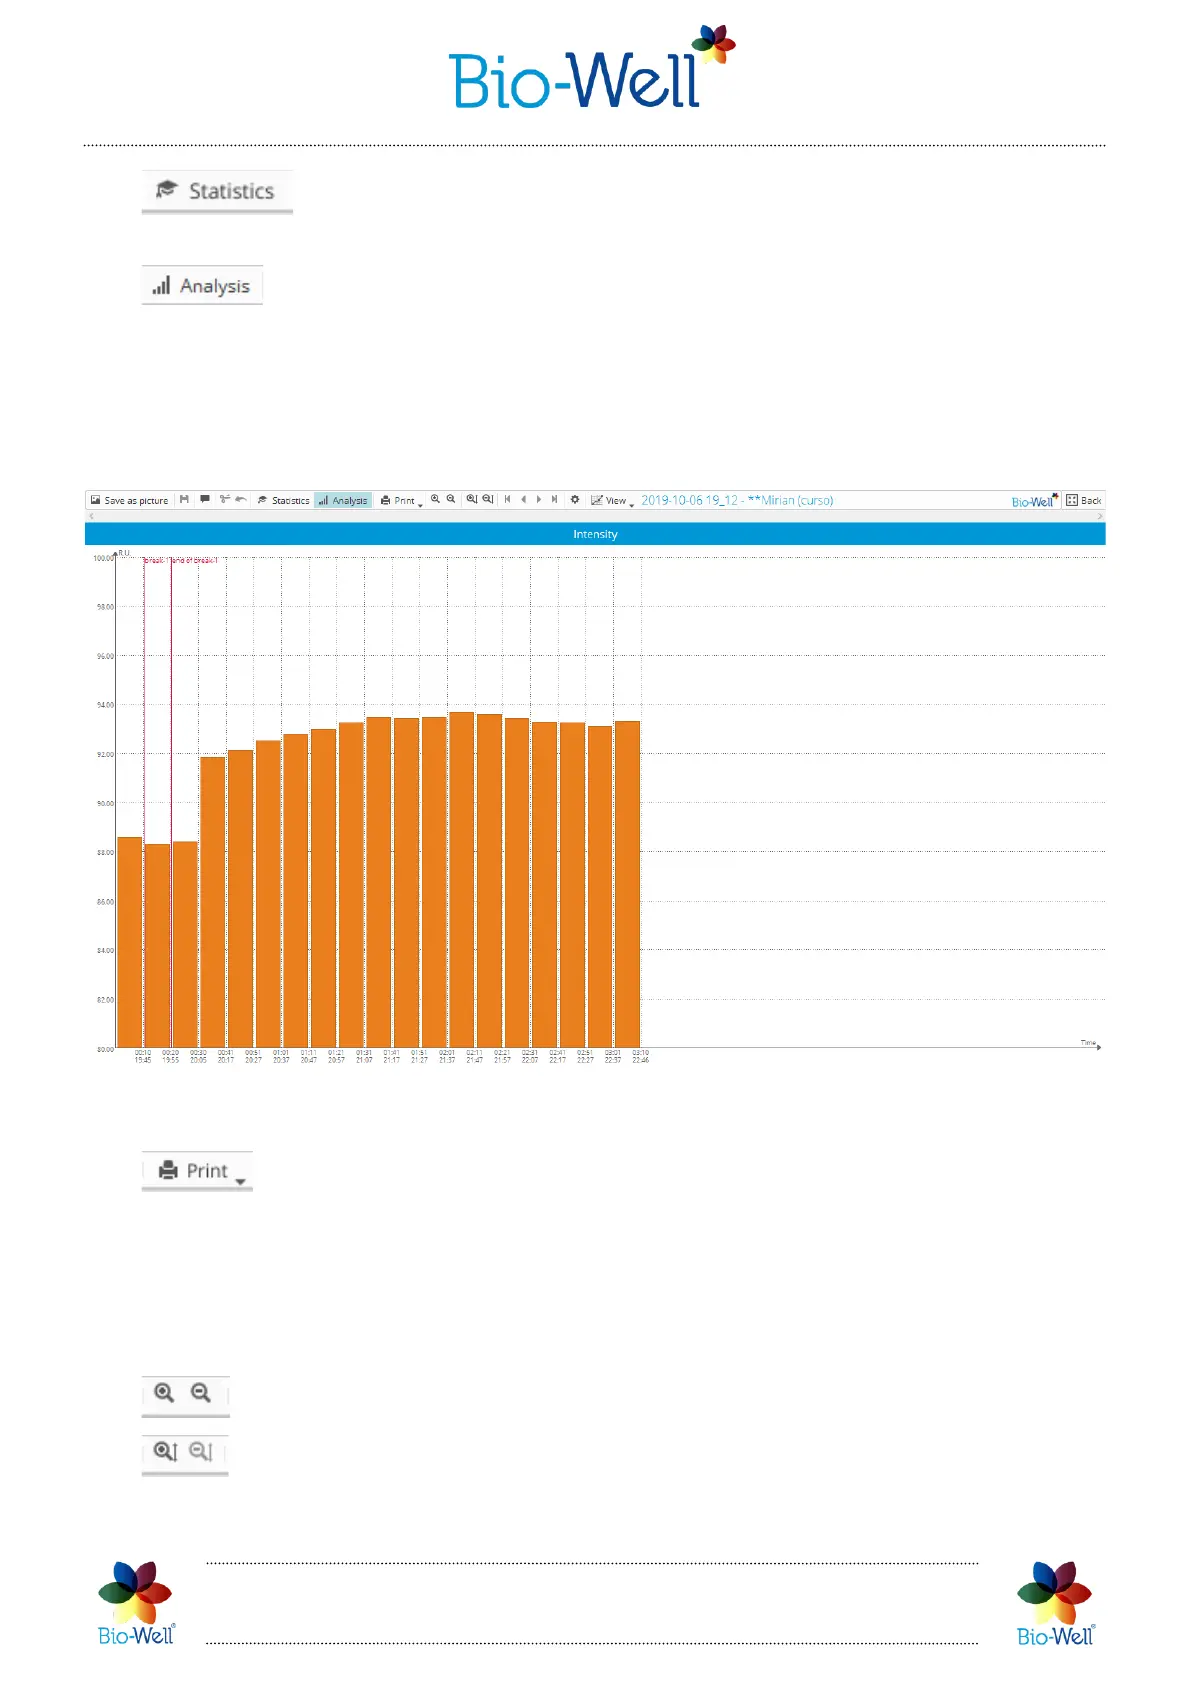
- click to view express processing of the results (bar-view). Graphs will
be cut into 300 GI intervals: each bar is equal to the average value of the given
parameter of 300 GI. Length in time of each bar will depend on the frequency of
capturing images. If you capture 1 image every second then each bar will be equal to
5 minutes interval.
Pic. 74. “Analysis” view of the results. Each bar = 300 images.
- click to open a drop-down list:
- Print all: send to printer all the available graphs (4).
- Print selected: send to printer only selected graphs that you see on the screen.
- Save as CSV: save all the experiment with all 4 parameters calculated to a CSV file
format.
- click these buttons to maximize or minimize the scale of the X axis.
- click these buttons to maximize or minimize the scale of the Y axis.
 Loading...