Bio-Well Company
www.bio-well.com
Top bar instruments panel is almost the same as on the initial screen with the
“Environment” Scan results.
If you point mouse cursor on any dot on the graph and click the right mouse button
– you will add a new label. You will be prompted to enter the name of the new label.
Once you have finished editing labels manually – click “Calculate” button to get the
statistical analysis of the 4 parameters for the periods between the labels that you have
added.
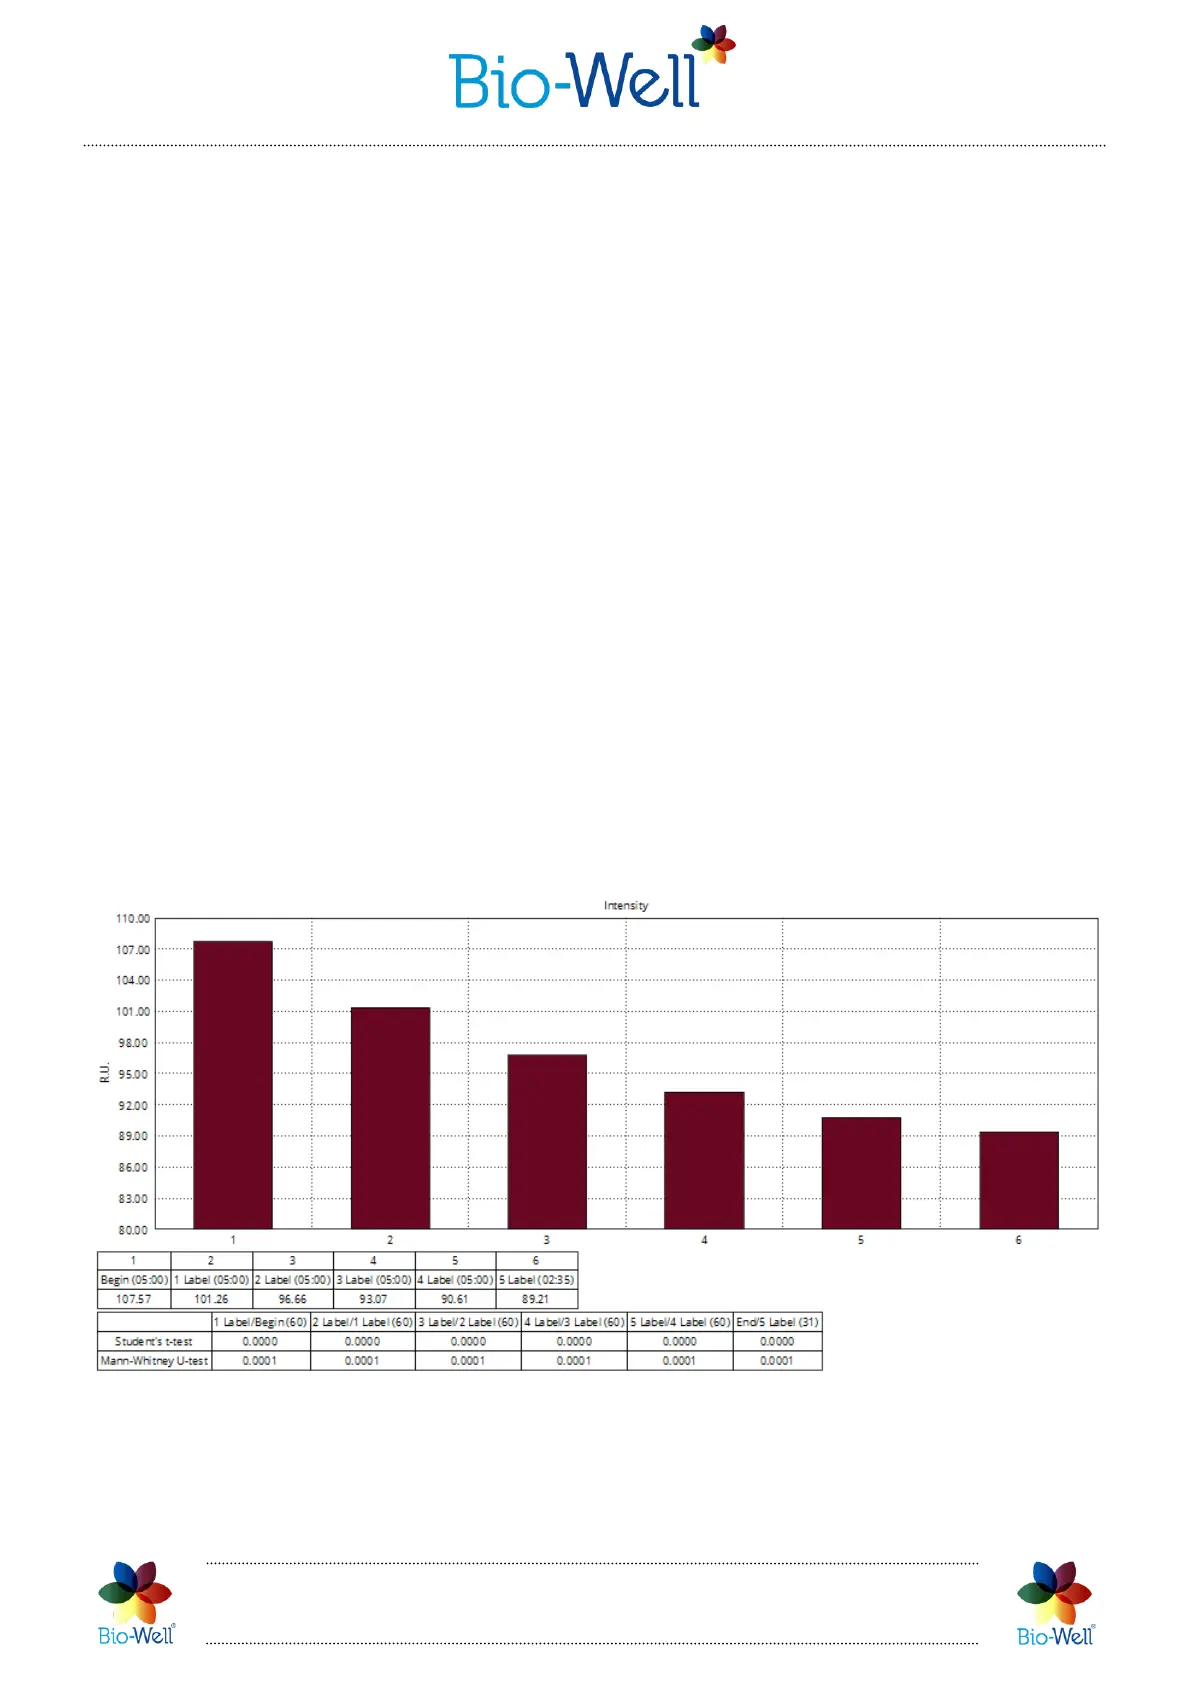
The Bio-Well Server will calculate parameters for all labeled intervals and
parametric / non-parametric statistical values. Every interval is compared with the
previous interval (pic. 77).
NB! For more correct statistical analysis please make sure that intervals that are
compared to each other contain same time period in them. In example, each interval is 5
minutes long – then they will contain equal number of images in them. Time volume of
the intervals depends on the kind of phenomenon under study.
In this report you can scroll through the pages with 4 different parameters
calculated for every interval specified. You can “Save as picture”, “Save as PDF”, “Save
as CSV” or print this report.
Pic. 77. Statistical analysis of the intervals between the labels in the “Environment” Scan.
Standard report consists of 4 pages: one page for each parameter – Area, Intensity,
Energy and Entropy.
 Loading...