Bio-Well Company
www.bio-well.com
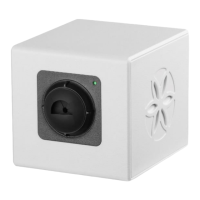
Pic. 79. Graphs tab view in “Full Scan” compare.
Comparing “Stress Test” Scans
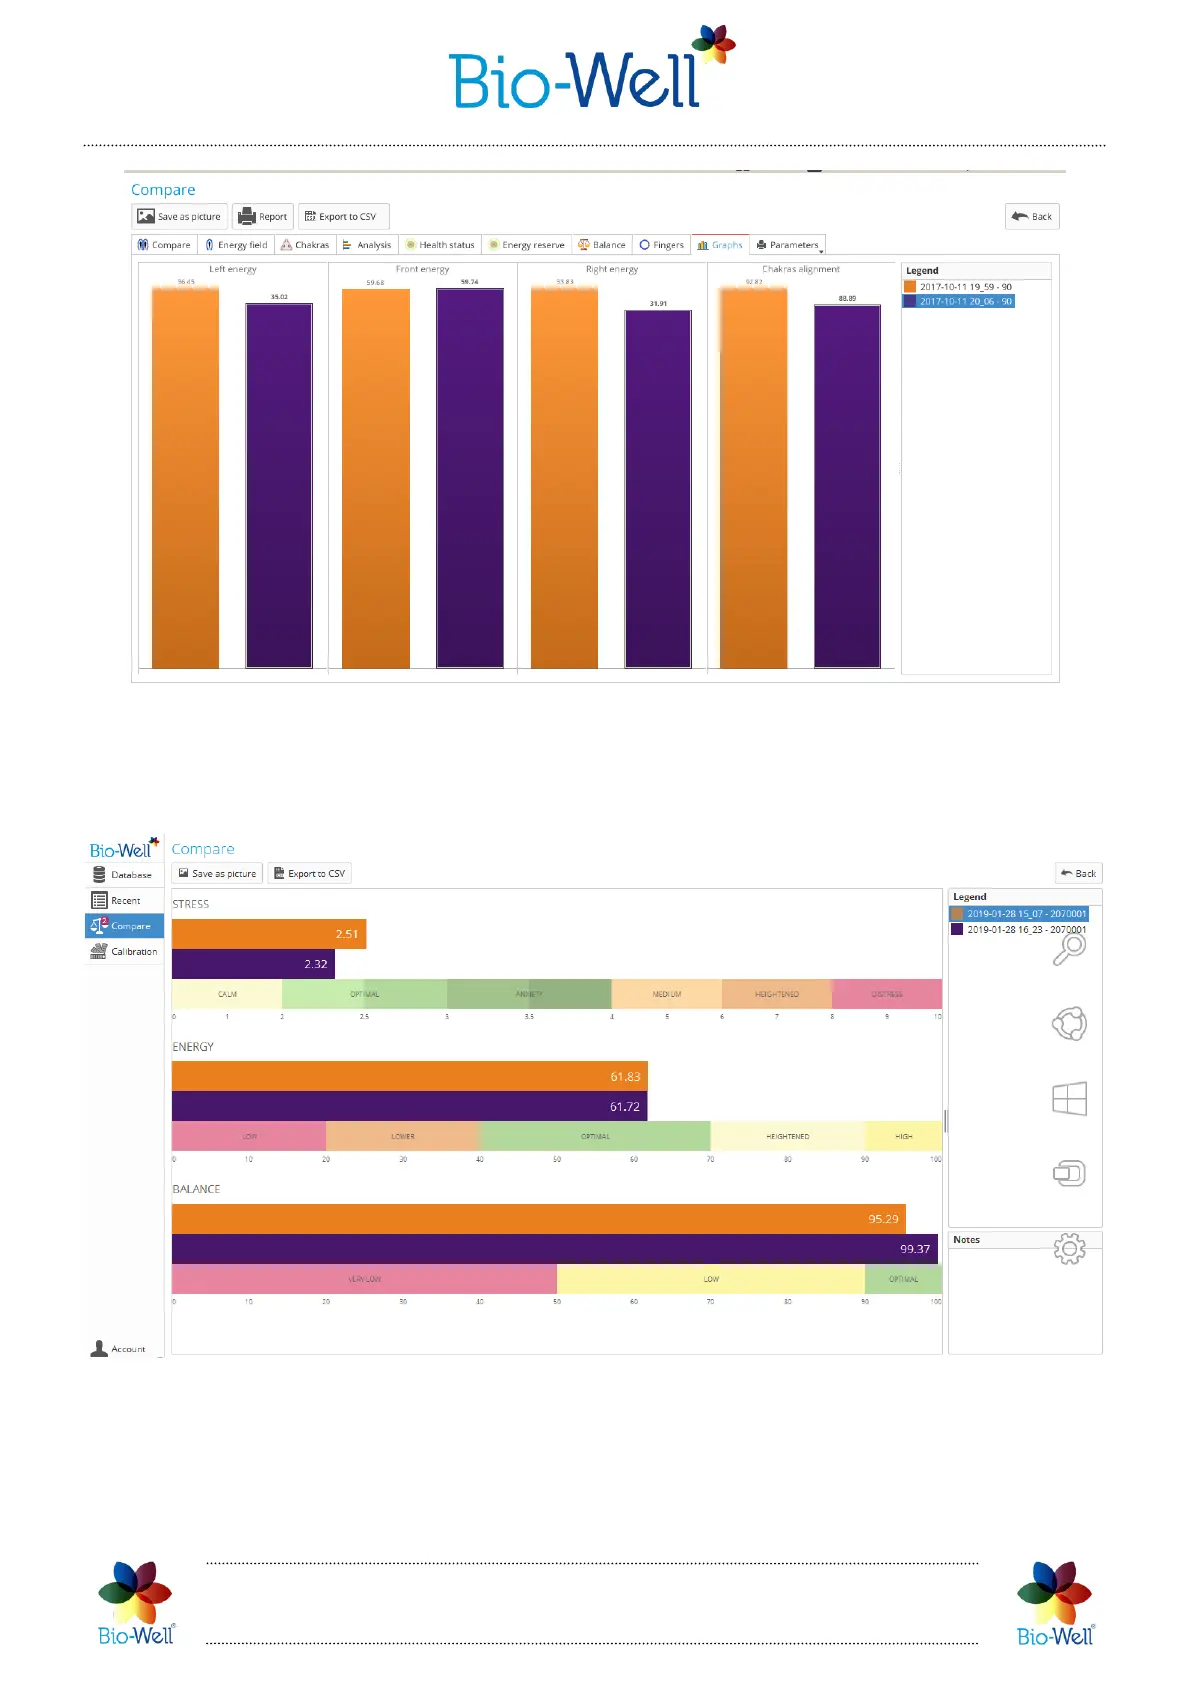
Pic. 80. Comparing Stress test scans.
If you are comparing “Stress test” Scans you will see such interface (pic. 80). Here
you can click “Save as picture” button in order to save the graphs or “Export to CSV”
button if you want to analyze the parameters in any program for statistical analysis
(Microsoft Excel, LibreOffice Calc, Algorithm, etc.).
 Loading...