Bio-Well Company
www.bio-well.com
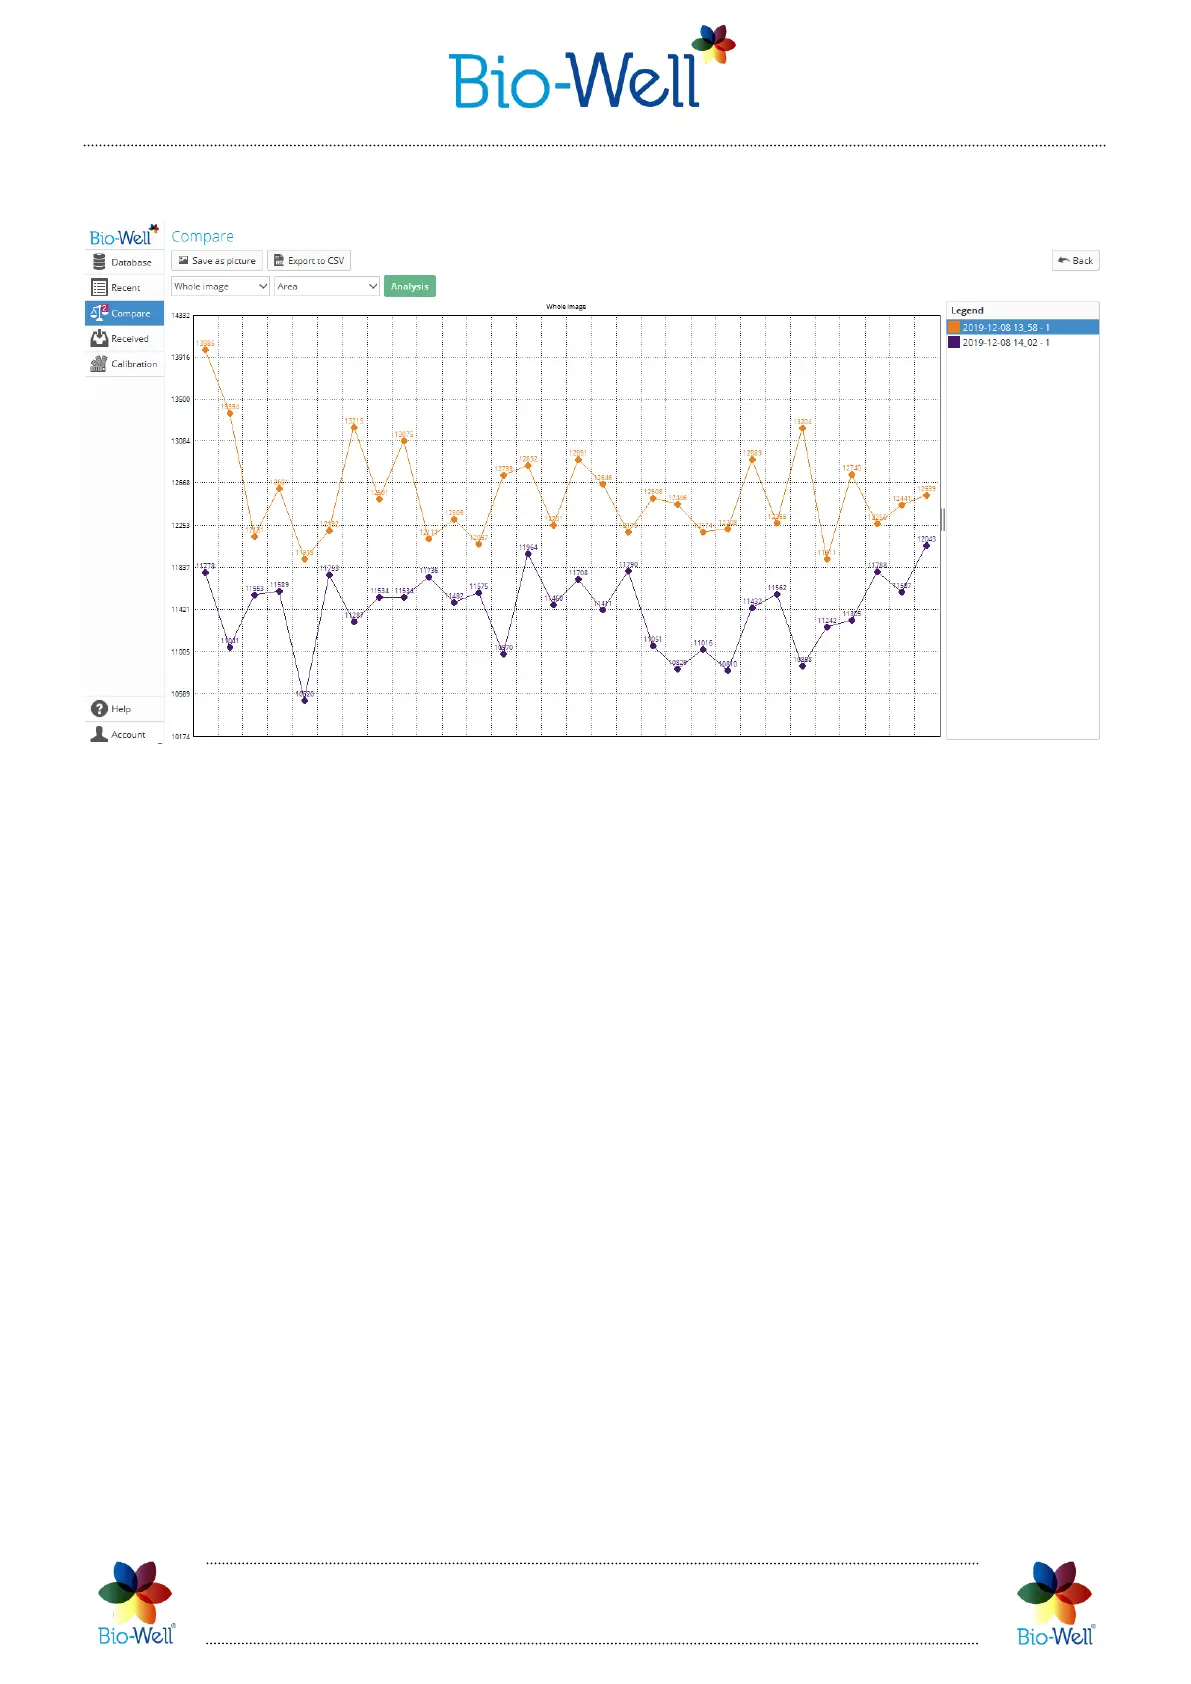
Comparing “One Finger” Scans
Pic. 81. Comparing «One finger» scans.
If you are comparing “One Finger” Scans then you will be able to select the “Whole
image” or specific sector from a drop-down list for which you want to see the graph,
and select any of the calculated parameters from the drop-down list.
To see the “Box-with-whiskers” plot view click the button “Analysis” and you will
get a statistical analysis of the graphs that makes it easier to compare the graphs
between each other (pic. 82).
Minimum (lower whisker): the lowest data point.
Maximum (higher whisker): the largest data point.
Median (Q2 / 50th Percentile – line with dot in the middle of the box): the middle
value of the dataset.
First quartile (Q1 / 25th Percentile – the floor of the box): is also known as
the lower quartile qn(0.25) and is the middle value between the smallest number (not
the minimum) and the median of the dataset.
Third quartile (Q3 / 75th Percentile – the ceiling of the box): is also known as
the upper quartile qn(0.75) and is the middle value between the largest number (not
the maximum) and the median of the dataset.[
 Loading...