OUTPUT POWER CURVES
The curves that follow depict the changes for each mode at specific power settings.
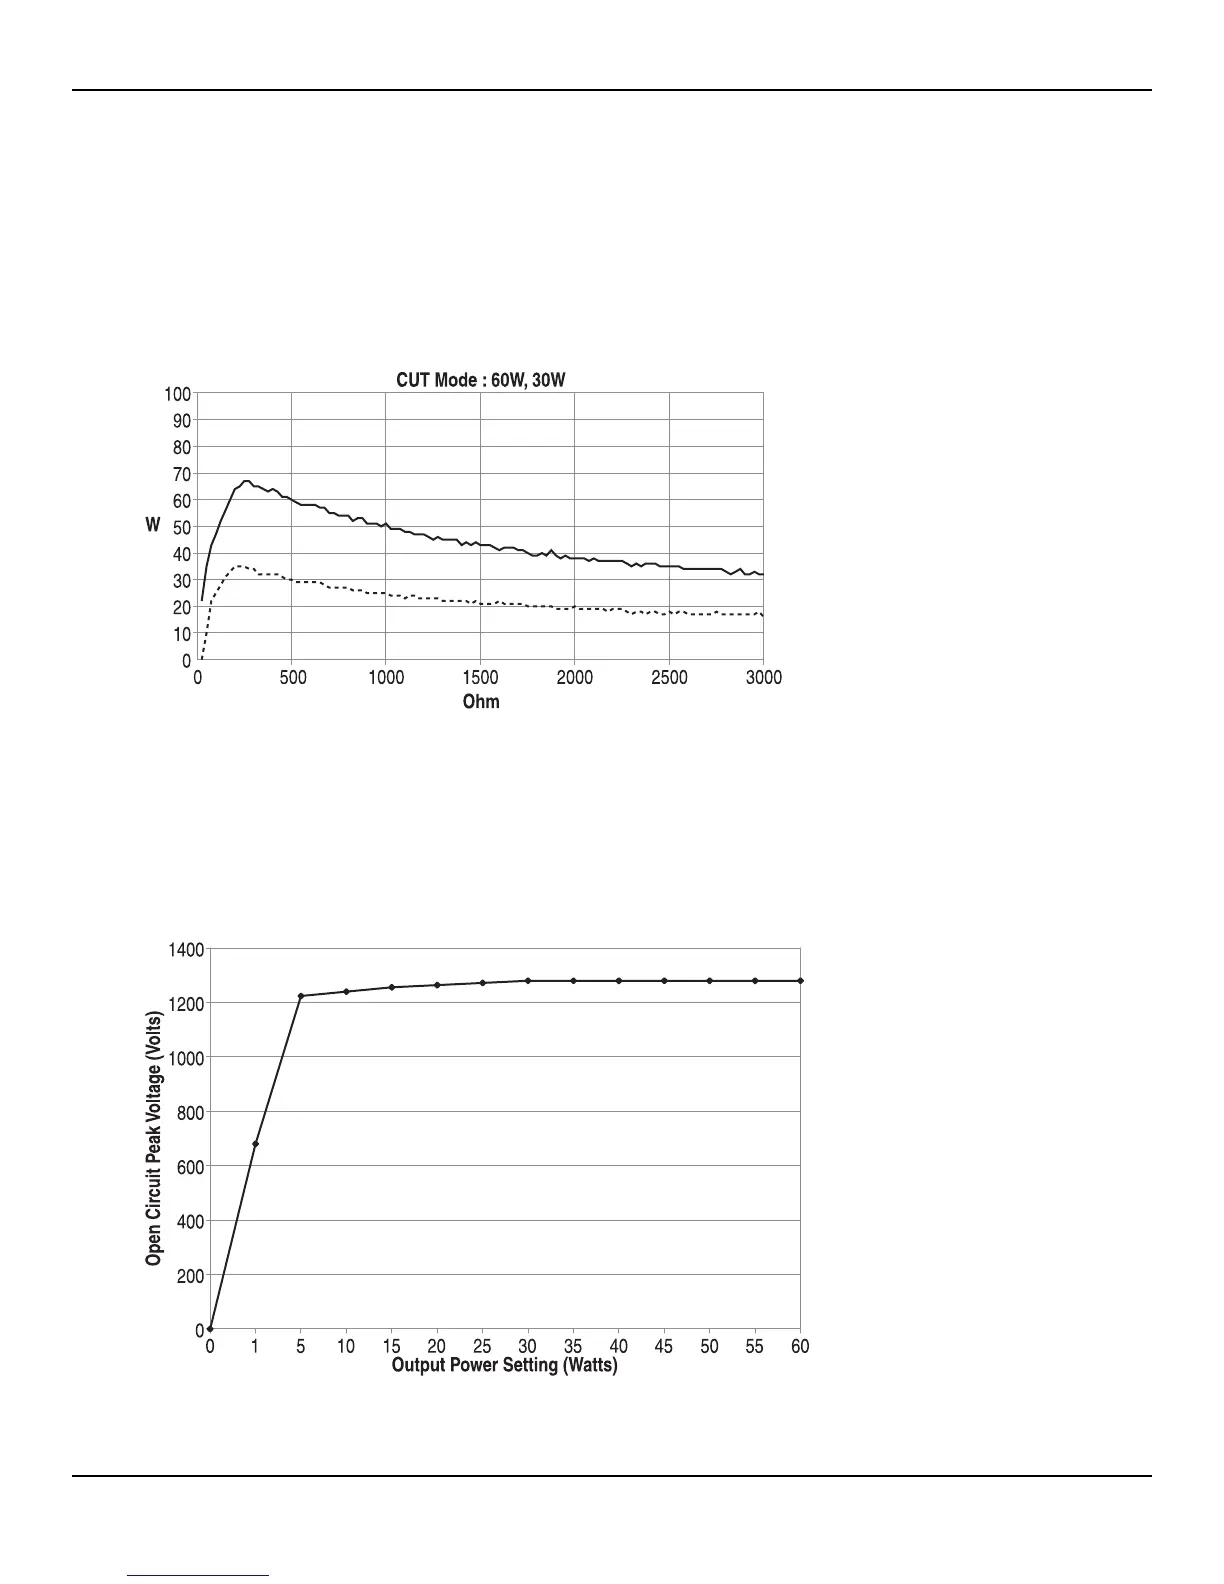
Monopolar Cut Curves
These measurements were taken using short (< 0.5 meter) leads. For each output power vs. impedance curve, the
upper curve represents readings taken at full power; the lower curve, readings taken at half power.
Figure A – 1 Output power versus impedance for cut mode
Figure A – 2 Peak voltage versus power setting for cut mode
A-9User’s Guide • Aaron 950™