6 | Organizer Measurements BYK-Gardner GmbH
40 wave-scan 3 / wave-scan 3 dual 301 200 085 E 2403
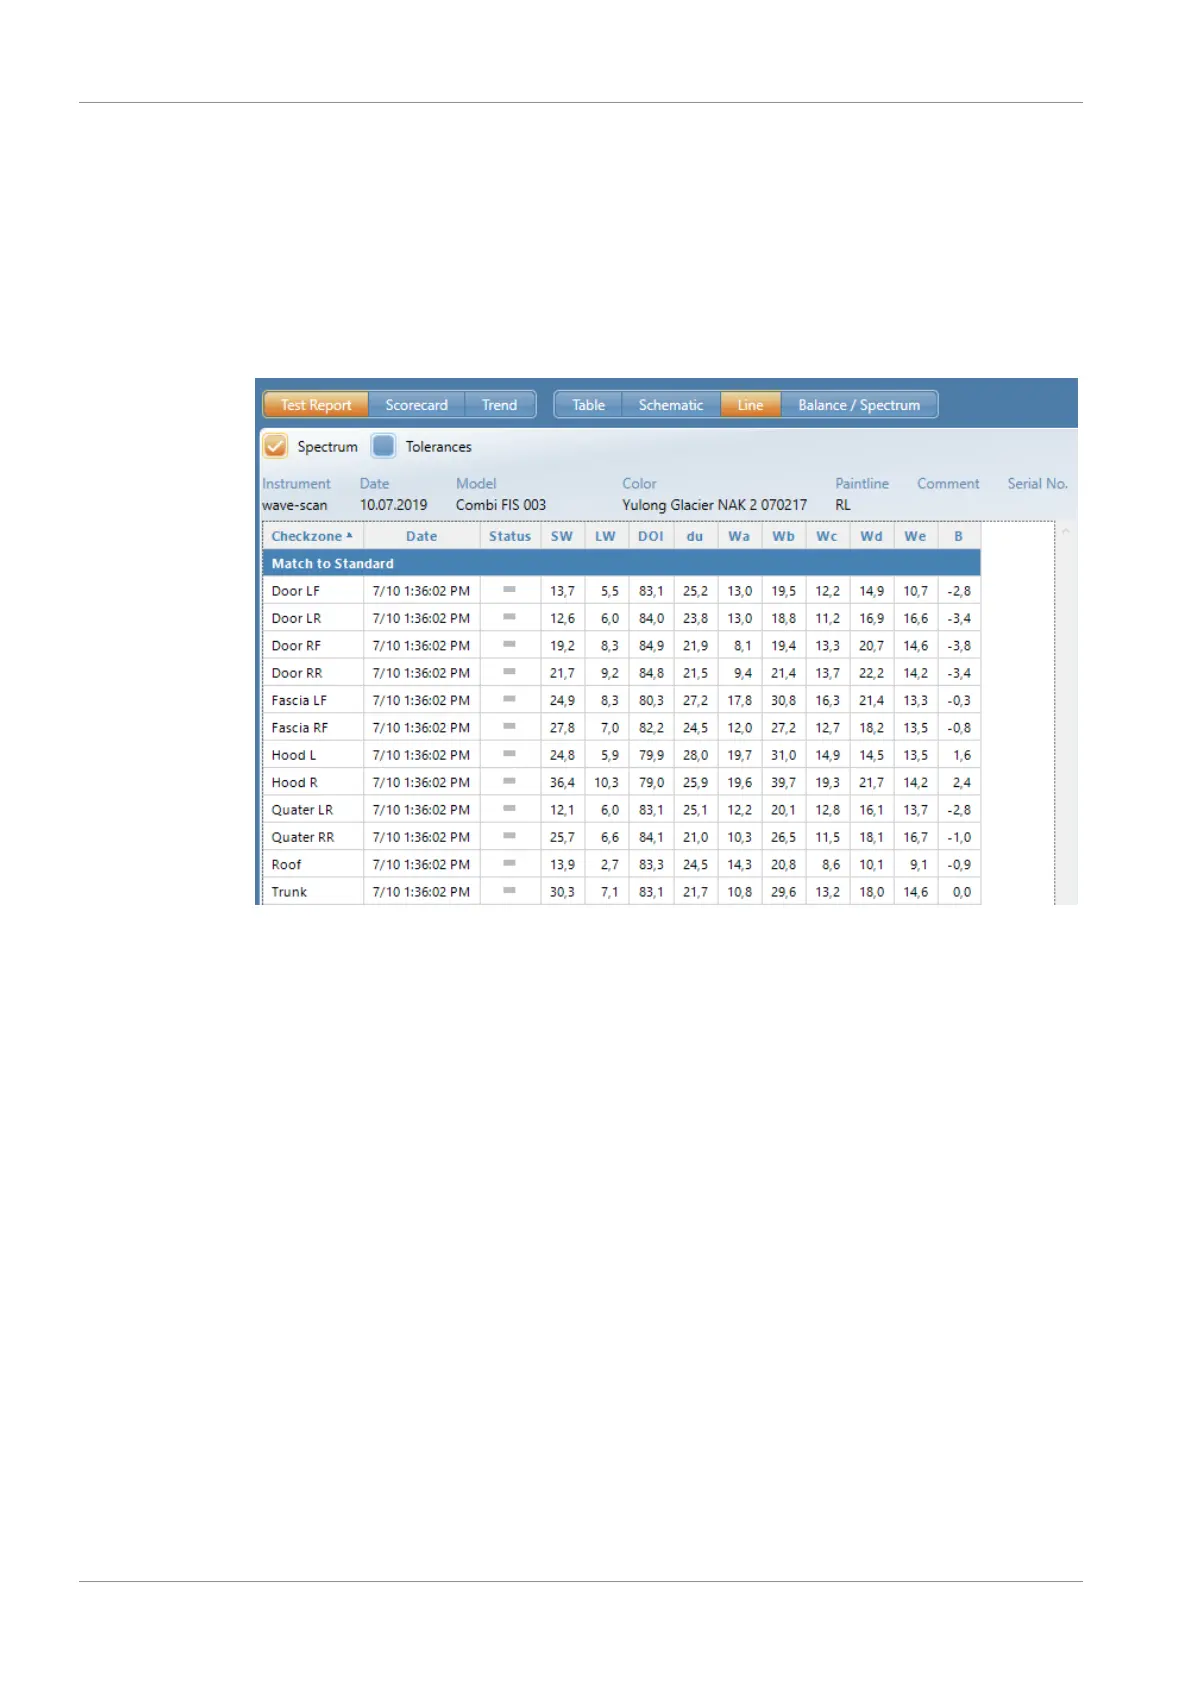
6.3 Upload to Database
The saved results are transferred to the PC and displayed as a QC report. The data is saved in a
database for further analysis over time. Pre-prepared test reports in the software “smart-chart”
assist in analyzing the data.
Storage Structure
Each measurement series contains a header and the individual measurements with their name
(check zone) and the measured values.
In the header, up to 5 parameters can be defined for object identification, for example:
• 1: Model
• 2: Color
• 3: Paint line
• 4: Comment
• 5: Vehicle-ID
Parameters #1 to #3 are defined in the organizer file, parameters #4 and #5 can be entered be-
fore storage in the database. Additionally, date and time of the measurements are stored.
This structure determines the data organization in the instrument and in the database. In addi-
tion to the definition of parameters before the measurements using organizers, the parameters
and check zones can also be entered during the measurements, see Standard Measurements
[}29].