6540 Series Operations Manual Rev_I 1/12/2016 49
Graph
The touch screen control panel has a graph built into it. The graph records actual chamber conditions for
UVA intensity, VIS intensity, temperature and humidity (optional). Data is plotted at 1 minute intervals for
up to 7 days. One hour (60 minutes) can be viewed on the screen at one time. The graph automatically starts
collecting data upon start-up and clears itself each time the unit is turned off. Graph data is for on-screen
viewing purposes only and can’t be exported or downloaded to other electronic devices.
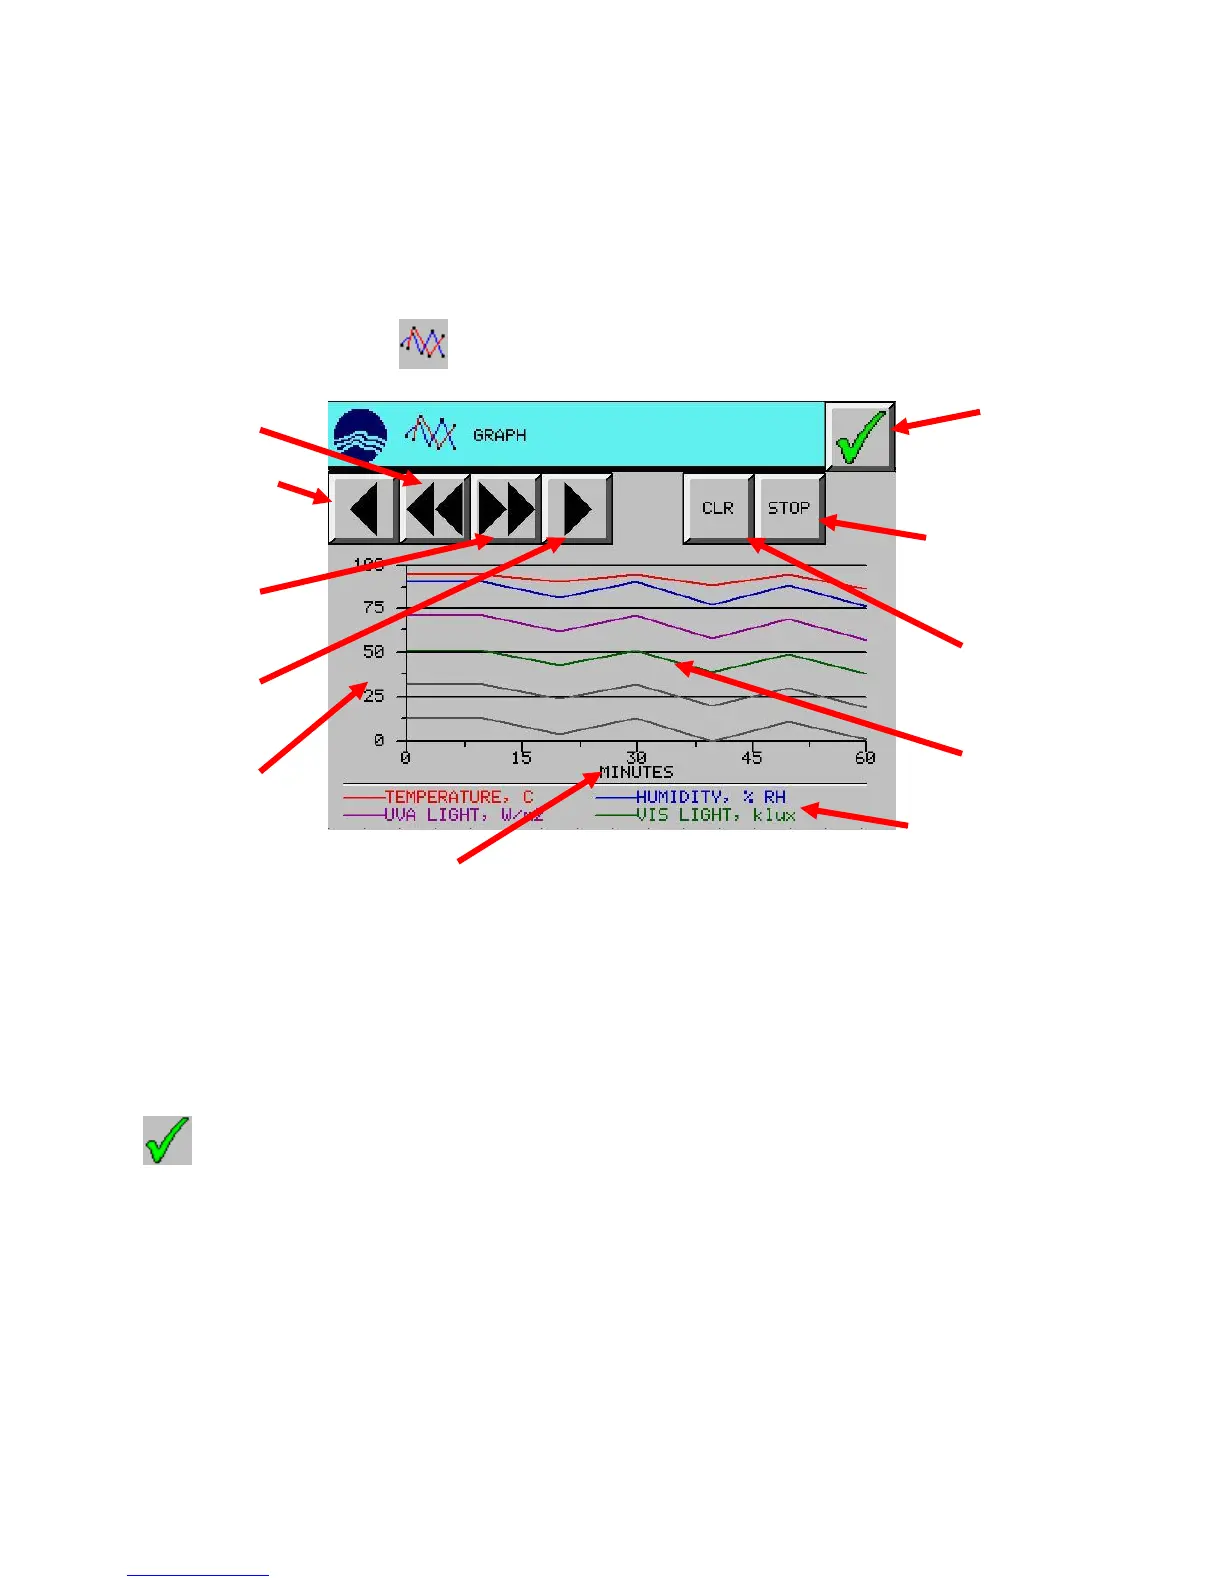
From the Setup Menu, press the (GRAPH) button.
The START/STOP button starts and stops the chart recording. (It is collecting data upon startup)
The CLR button clears the graph data and starts plotting a new graph.
The scroll left button scrolls the graph back (left) by 30 minutes.
The scroll right button scrolls the graph forward (right) by 30 minutes.
The scroll to beginning button scrolls the graph to the graph beginning (0 minutes).
The scroll to end button scrolls the graph to the end (current time frame).
Press (EXIT) button to return to the setup menu screen.
Chart START /
STOP button
Scroll to beginning
button