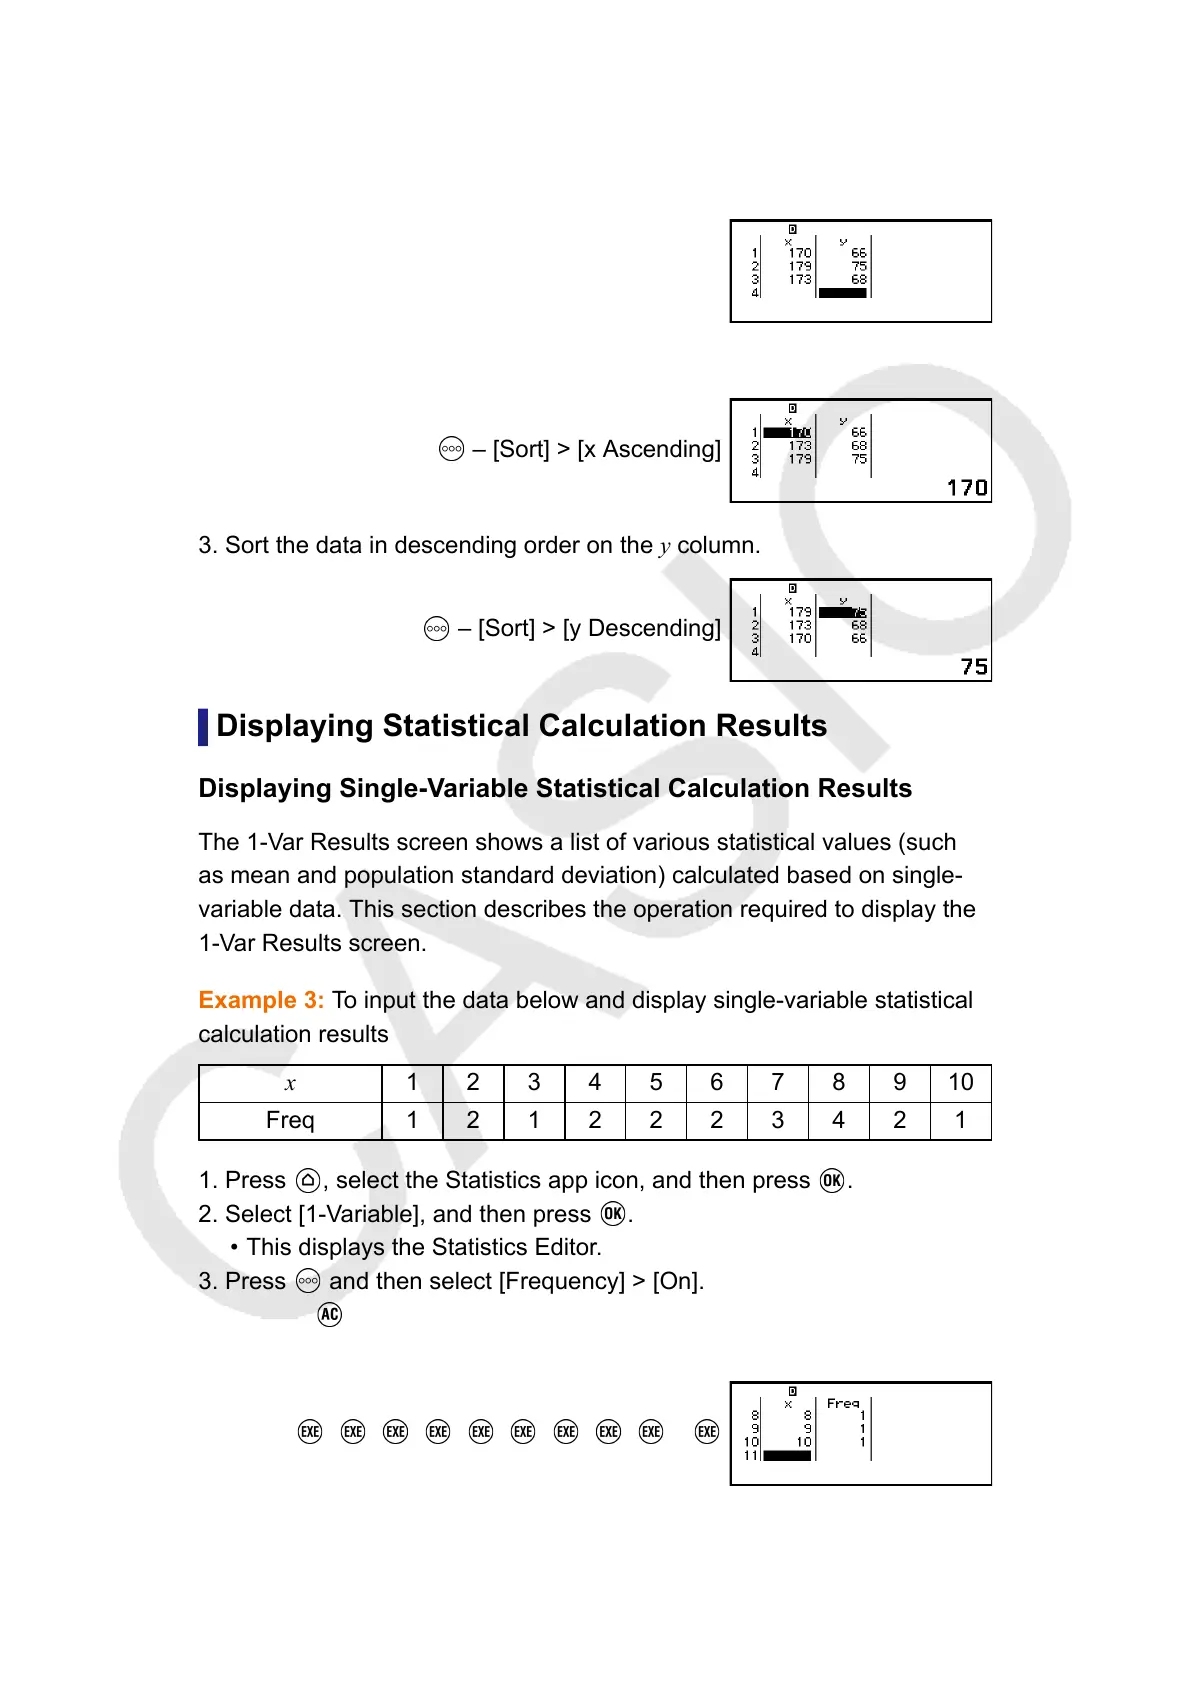
Example 2: To sort the data input in Example 1 (page 67) in ascending
order on the x column, and then in descending order on the y column
1. Use the procedure in Example 1 to input the data.
2. Sort the data in ascending order on the x column.
– [Sort] > [x Ascending]
3. Sort the data in descending order on the y column.
– [Sort] > [y Descending]
Displaying Statistical Calculation Results
Displaying Single-Variable Statistical Calculation Results
The 1-Var Results screen shows a list of various statistical values (such
as mean and population standard deviation) calculated based on single-
variable data. This section describes the operation required to display the
1-Var Results screen.
Example 3: To input the data below and display single-variable statistical
calculation results
x
1 2 3 4 5 6 7 8 9 10
Freq 1 2 1 2 2 2 3 4 2 1
1. Press , select the Statistics app icon, and then press .
2. Select [1-Variable], and then press .
• This displays the Statistics Editor.
3. Press and then select [Frequency] > [On].
•
Press to return to the Statistics Editor.
4. Input data into the x-column.
1 2 3 4 5 6 7 8 9 10
5. Input data into the Freq column.
69

 Loading...