6-2
• List
The initial default statistical data is List 1 for single-variable data, and List 1 and List 2 for
paired-variable data. You can specify which statistical data list you want to use for
x-data and
y-data.
• Frequency
Normally, each data item or data pair in the statistical data list is represented on a graph as
a point. When you are working with a large number of data items however, this can cause
problems because of the number of plot points on the graph. When this happens, you can
specify a frequency list that contains values indicating the number of instances (the frequency)
of the data items in the corresponding cells of the lists you are using for
x-data and y-data.
Once you do this, only one point is plotted for the multiple data items, which makes the graph
easier to read.
• Mark Type
This setting lets you specify the shape of the plot points on the graph.
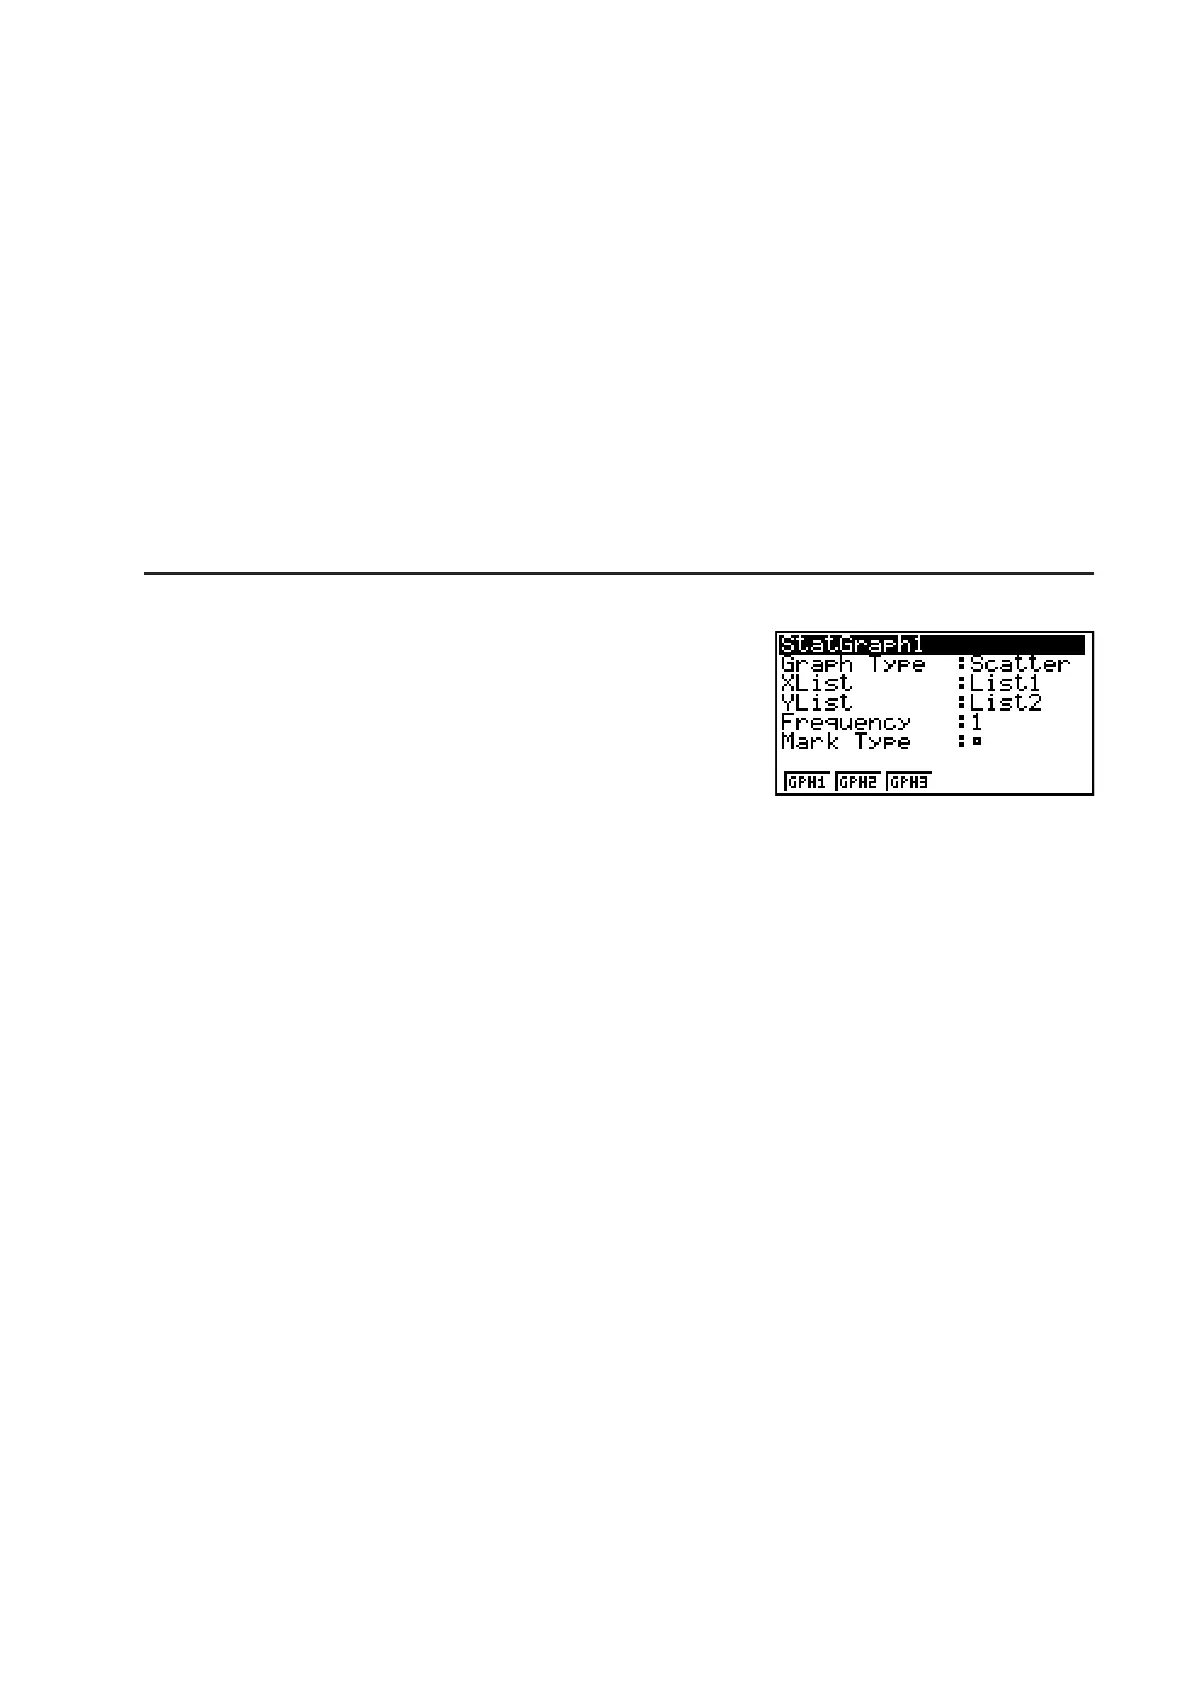
S To display the general graph settings screen [GRPH]-[SET]
Pressing (GRPH)(SET) displays the general graph
settings screen.
• StatGraph (statistical graph specification)
•{GPH1}/{GPH2}/{GPH3} ... graph {1}/{2}/{3}
• Graph Type (graph type specification)
•{Scat}/{
xy}/{NPP}/{Pie} ... {scatter diagram}/{xy line graph}/{normal probability plot}/{pie
graph}
•{Hist}/{Box}/{Bar}/{N·Dis}/{Brkn} ... {histogram}/{med-box graph}/{bar graph}/{normal
distribution curve}/{broken line graph}
•{X}/{Med}/{X^2}/{X^3}/{X^4} ... {linear regression graph}/{Med-Med graph}/{quadratic
regression graph}/{cubic regression graph}/{quartic regression graph}
•{Log}/{Exp}/{Pwr}/{Sin}/{Lgst} ... {logarithmic regression graph}/{exponential regression
graph}/{power regression graph}/{sinusoidal regression graph}/{logistic regression
graph}
• XList (
x-axis data list)/YList (y-axis data list)
•{List} ... {List 1 to 26}
• Frequency (number of times a value occurs)
•{1} ... {1-to-1 plot}
•{List} ... {List 1 to 26}
• Mark Type (plot mark type)
•{U}/{s}/{•} ... scatter diagram plot points
When “Pie” (pie graph) is selected as the Graph Type:
• Data (Specifies the list to be used as graph data.)
•{LIST} ... {List 1 to List 26}

 Loading...


