6-3
• Display (pie graph value display setting)
•{%}/{Data} ... For each data element {display as percentage}/{display as value}
• % Sto Mem (Specifies storage of percentage values to a list.)
•{None}/{List} ... For percentage values: {Do not store to list}/{Specify List 1 to 26 and store}
When “Box” (med-box graph) is selected as the Graph Type:
• Outliers (outliers specification)
•{On}/{Off} ... {display}/{do not display} Med-Box outliers
When “Bar” (bar graph) is selected as the Graph Type:
• Data1 (first stick data list)
•{LIST} ... {List 1 to 26}
• Data2 (second stick data list)/Data3 (third stick data list)
•{None}/{LIST} ... {none}/{List 1 to 26}
• Stick Style (stick style specification)
•{Leng}/{HZtl} ... {length}/{horizontal}
2. Graph draw/non-draw status [GRPH]-[SEL]
The following procedure can be used to specify the draw (On)/non-draw (Off) status of each of
the graphs in the graph menu.
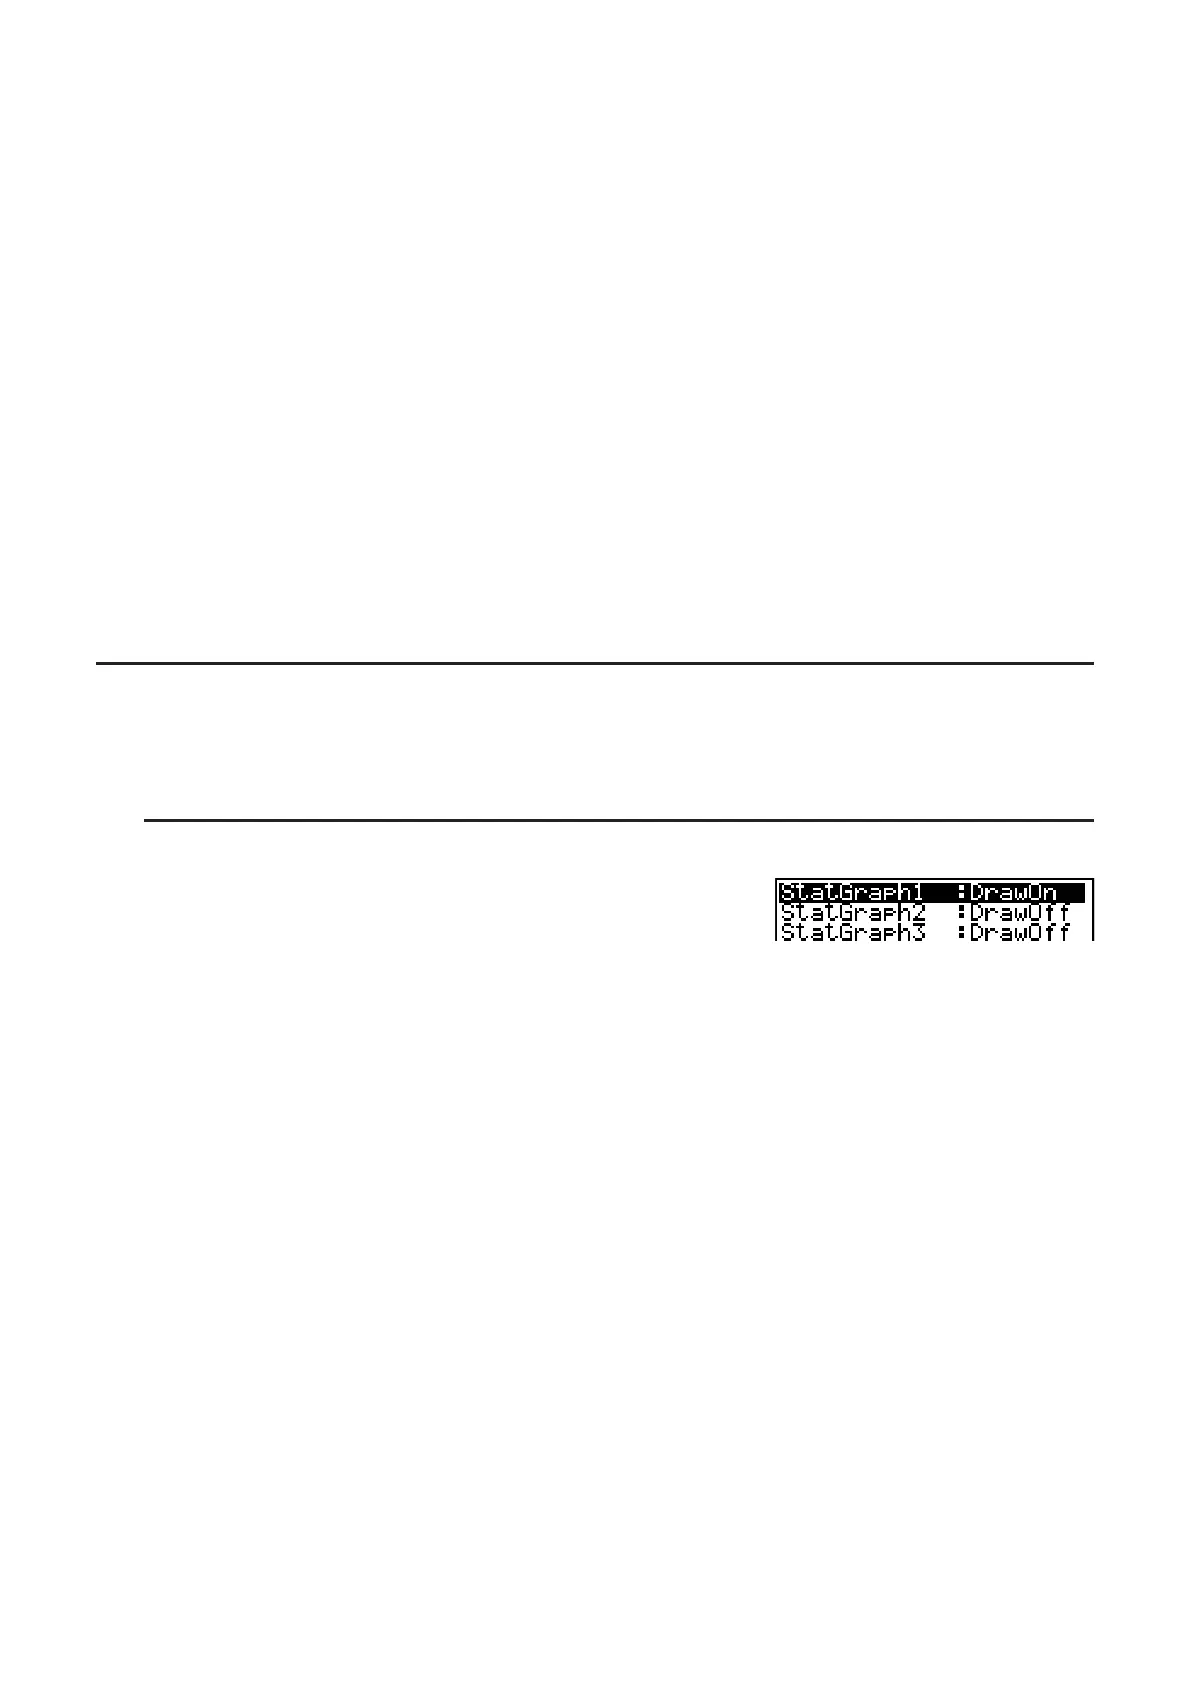
S To specify the draw/non-draw status of a graph
1. Pressing (GRPH)(SEL) displays the graph On/Off
screen.
• Note that the StatGraph1 setting is for Graph 1 (GPH1 of the graph menu), StatGraph2 is
for Graph 2, and StatGraph3 is for Graph 3.
2. Use the cursor keys to move the highlighting to the graph whose status you want to change,
and press the applicable function key to change the status.
•{On}/{Off} ... {On (draw)}/{Off (non-draw)}
•{DRAW} ... {draws all On graphs}
3. To return to the graph menu, press ).
• V-Window parameters are normally set automatically for statistical graphing. If you want to
set V-Window parameters manually, you must change the Stat Wind item to “Manual”.
While the statistical data list is on the display, perform the following procedure.
K(SET UP)(Man)
)(Returns to previous menu.)
Note that V-Window parameters are set automatically for the following types of graphs
regardless of whether or not the Stat Wind item is set to “Manual”.
Pie, 1-Sample
Z Test, 2-Sample Z Test, 1-Prop Z Test, 2-Prop Z Test, 1-Sample t Test, 2-
Sample t Test, C
2
GOF Test, C
2
2-way Test, 2-Sample F Test (x-axis only disregarded).
• The default setting automatically uses List 1 data as
x-axis (horizontal) values and List 2 data
as y-axis (vertical) values. Each set of x/y data is a point on the scatter diagram.

 Loading...


