Chapter 13: Spreadsheet Application 239
Z Tests, t Tests, Two-Sample F Test, and Interval Calculations
• Operation when inputting values directly on the wizard screen and performing the calculation is identical to
that when “Variable” is elected on the Statistics operation wizard screen.
• When the number of numeric input fields on the wizard screen is
m, prepare n rows and m columns of data.
For example, in the case of the 1-Sample Z Test, there are four numeric
input fields as shown in the nearby screenshot. In this case, selecting 2 rows
× 4 columns of data (A1:D2) on the spreadsheet and running the wizard will
automatically input cell references into each field as shown in the nearby
screenshot. Increasing the number of rows causes batch calculation of each
line to be performed.
Important!
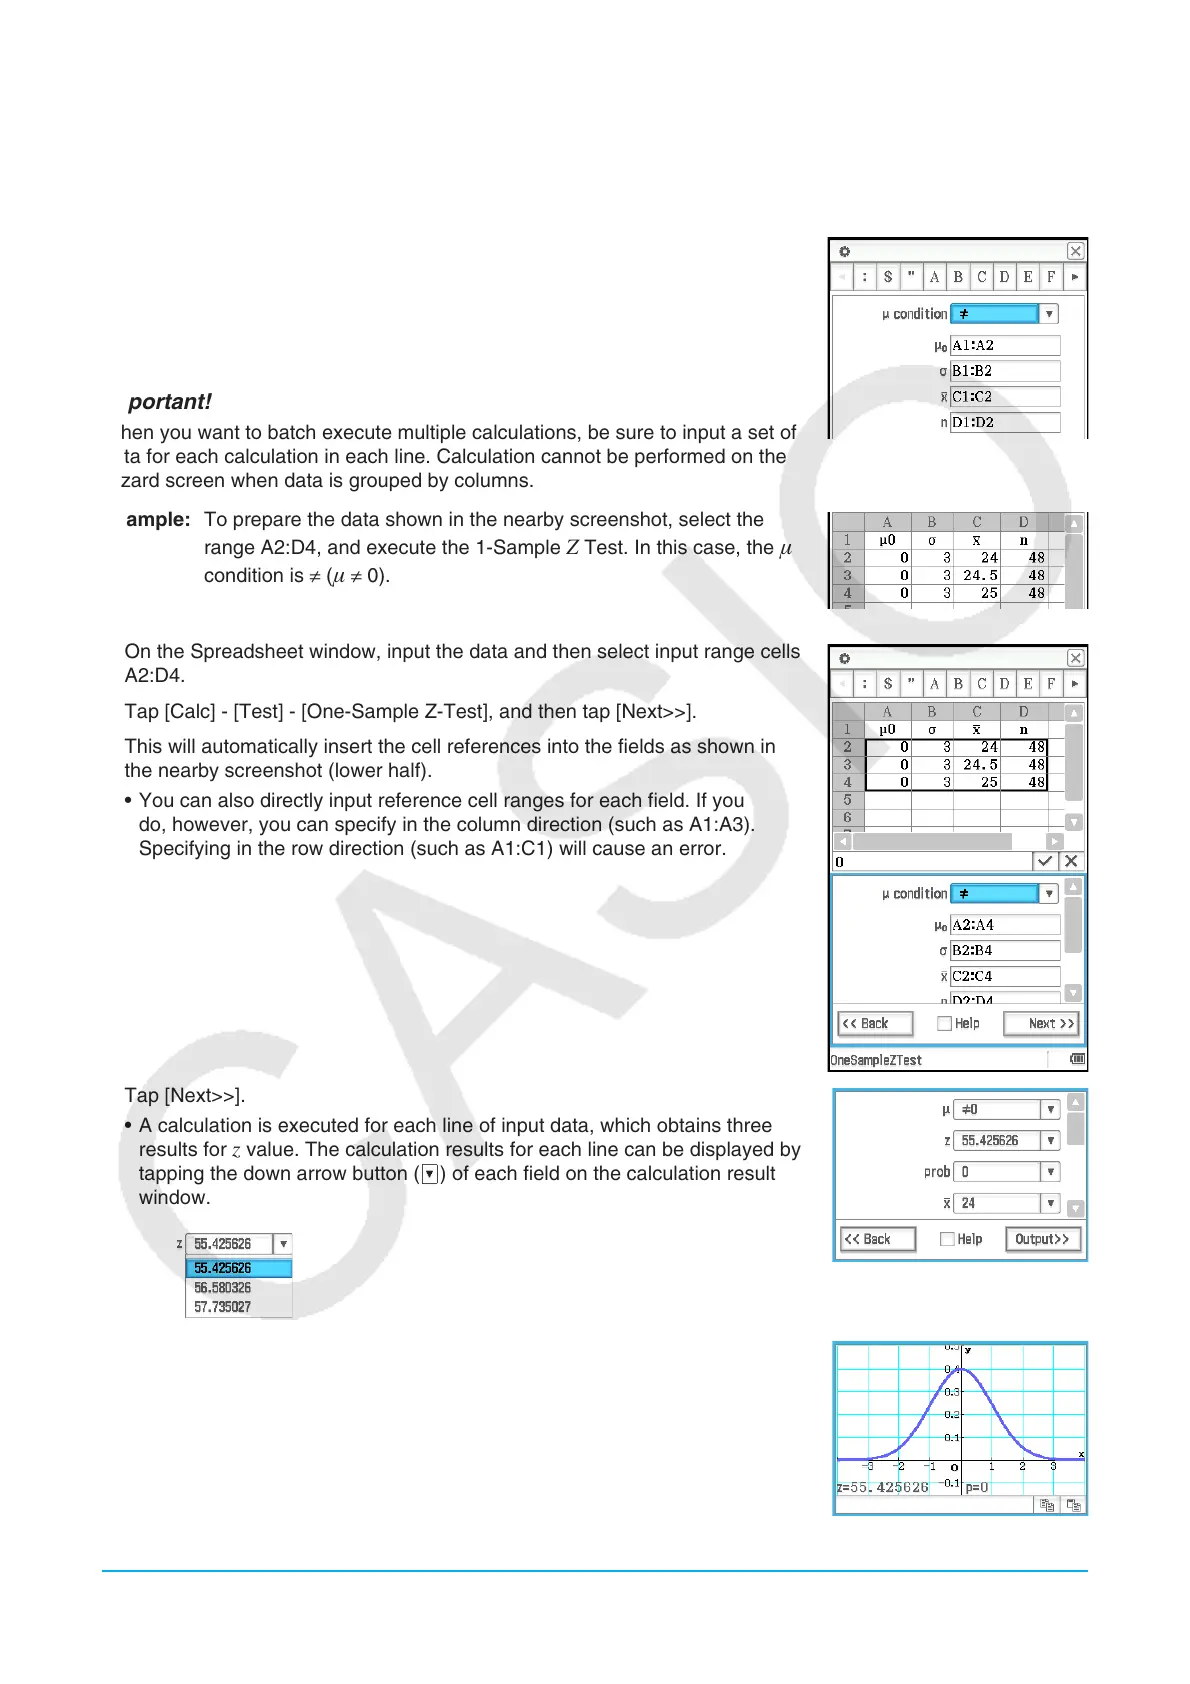
When you want to batch execute multiple calculations, be sure to input a set of
data for each calculation in each line. Calculation cannot be performed on the
wizard screen when data is grouped by columns.
Example: To prepare the data shown in the nearby screenshot, select the
range A2:D4, and execute the 1-Sample
Z Test. In this case, the
condition is ≠ ( ≠ 0).
1. On the Spreadsheet window, input the data and then select input range cells
A2:D4.
2. Tap [Calc] - [Test] - [One-Sample Z-Test], and then tap [Next>>].
3. This will automatically insert the cell references into the fields as shown in
the nearby screenshot (lower half).
• You can also directly input reference cell ranges for each field. If you
do, however, you can specify in the column direction (such as A1:A3).
Specifying in the row direction (such as A1:C1) will cause an error.
4. Tap [Next>>].
• A calculation is executed for each line of input data, which obtains three
results for
z value. The calculation results for each line can be displayed by
tapping the down arrow button (v) of each field on the calculation result
window.
5. To graph the calculation results as a normal distribution graph, tap $.