CEMB PoInTer program 9 - 9
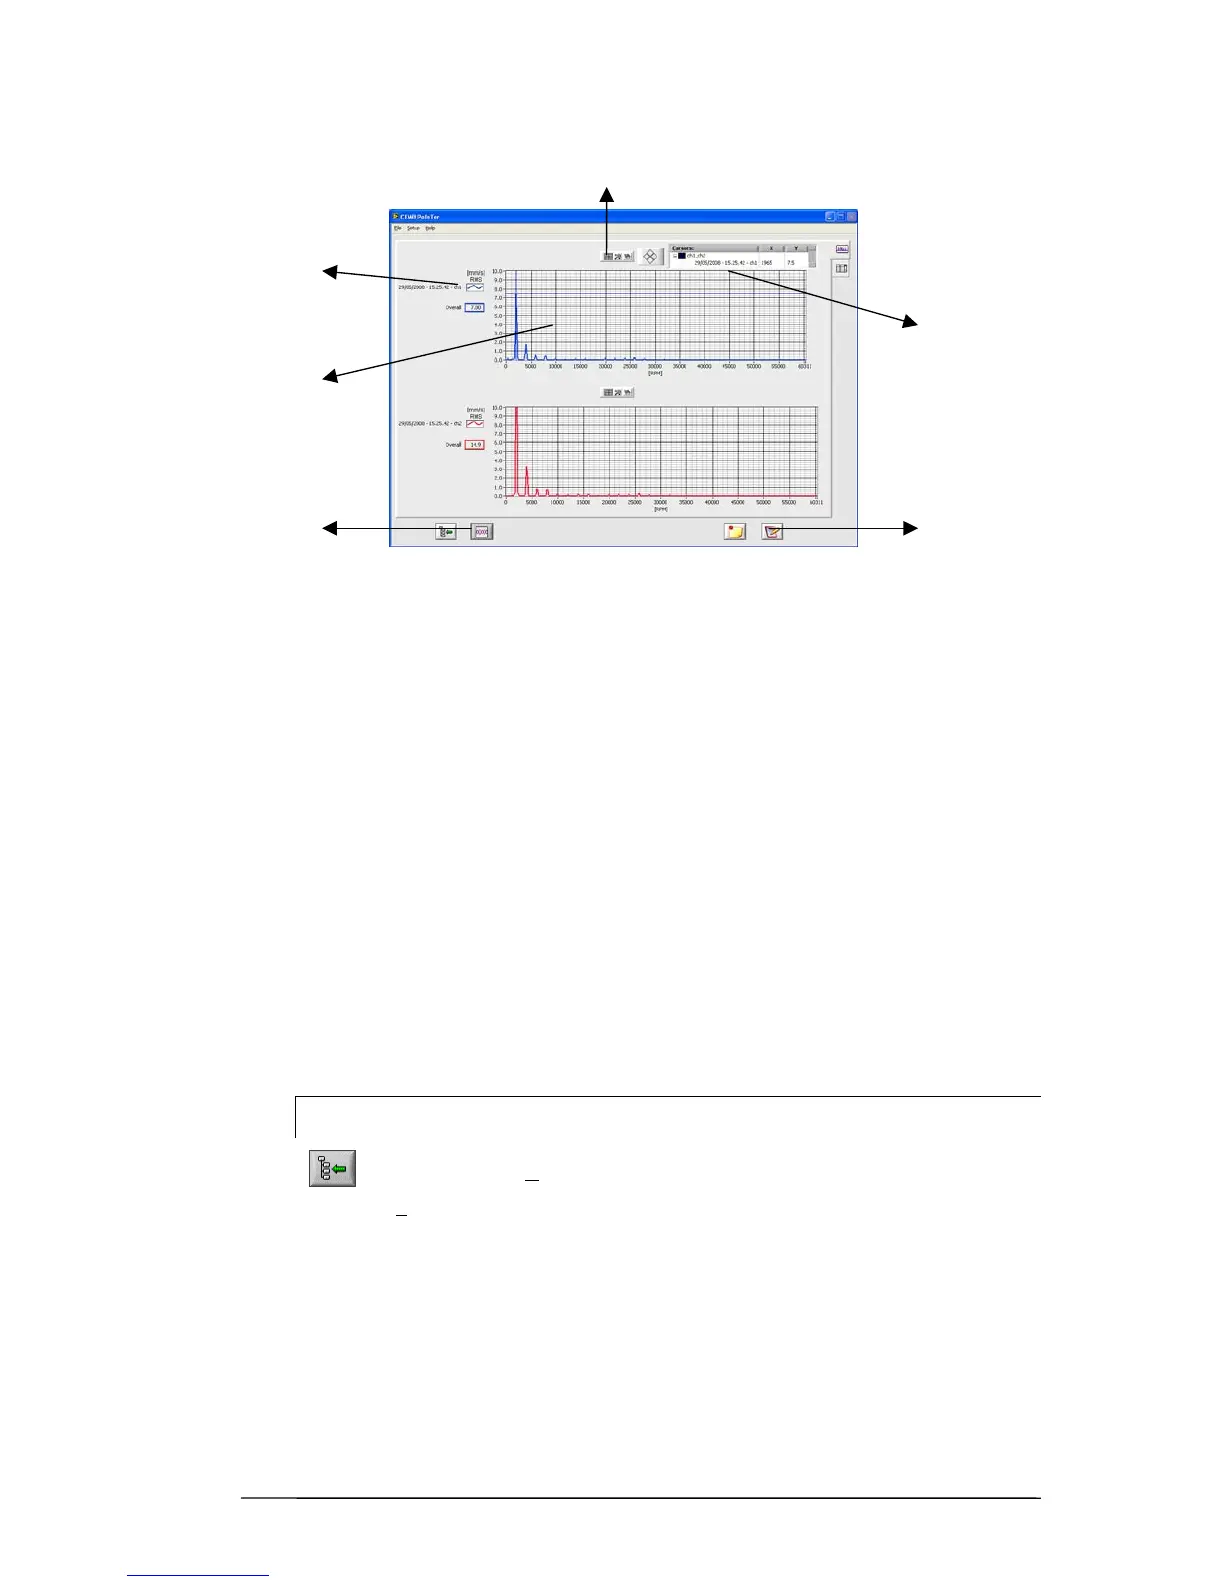
Display of graphs
1 – area of the graph
2 – list of measurements plotted (indicating the channel to which they belong)
3 – information regarding the cursor
- measurement with which it is associated
- point of the archive to which such measurement belongs
- current co-ordinates
- keys or buttons to shift it
4 – graphic functions:
- dragging of cursor
- zoom
- shifting of graphs in the window
5 – general functions
- return to main screen “Data Manager”
- separate / combine graphs
- add notes
- create certificate (report)
N.B.
Return to the "Data Manager" page is possible, besides by pressing
Also by selecting File
Æ
Return Back from the menu.
Using the Setup
Æ
measurement unit option it is possible to select between metric
units (g, mm/s, µm) and imperial units (g, inc/s, mils), or Hz and RPM.
2
1
5
3
5
4