CEMB PoInTer program 9 - 11
Shifting the graphs in the window
After selecting it is possible to click on a point of the graph, then by holding
down the mouse button, the entire graph can be shifted within the window. In practice,
this corresponds to changing the minimum and maximum limits of both axes, without this,
however, altering the scale. When the cursor is moved outside the window, the graph
returns to the position prior to the shifting.
N.B.
The minimum and maximum values of the axes can be modified one-by-one, by
merely clicking on them and entering a new value via the keyboard.
N.B.
After modifying the zoom, or shifting the graph, it is possible to return to the initial
view with the option of the contextual menu.
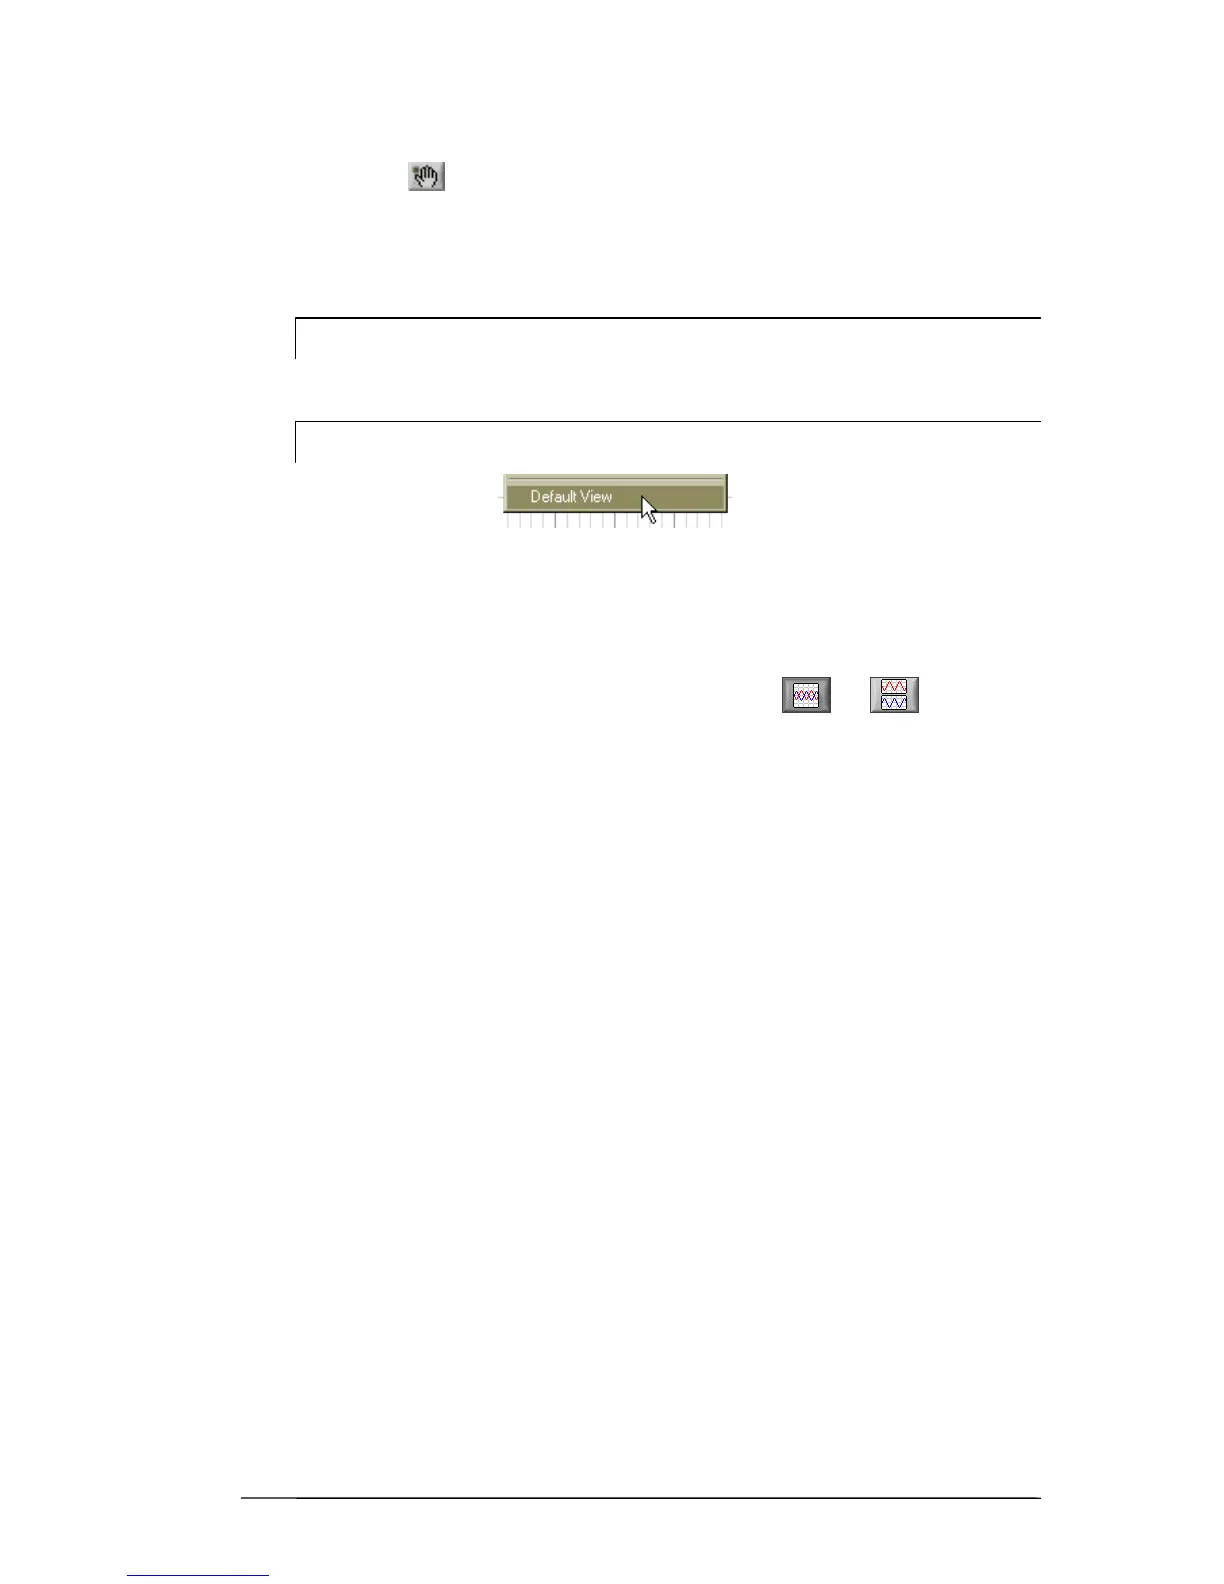
Separate/combine graphs
If it is wished to represent two or more measurements, this can be done in a single graph
(default) or in two or more separate graphs (a maximum of three), with one measurement
in each of them. To switch from one mode to the other press or respectively.