Local Basic Operations 135
Select from the dropdown list.
4.7.1.8 Heat map
You can detect the active objects distribution in the monitor zone during the specified period, and
use different colors to display on the heat map report.
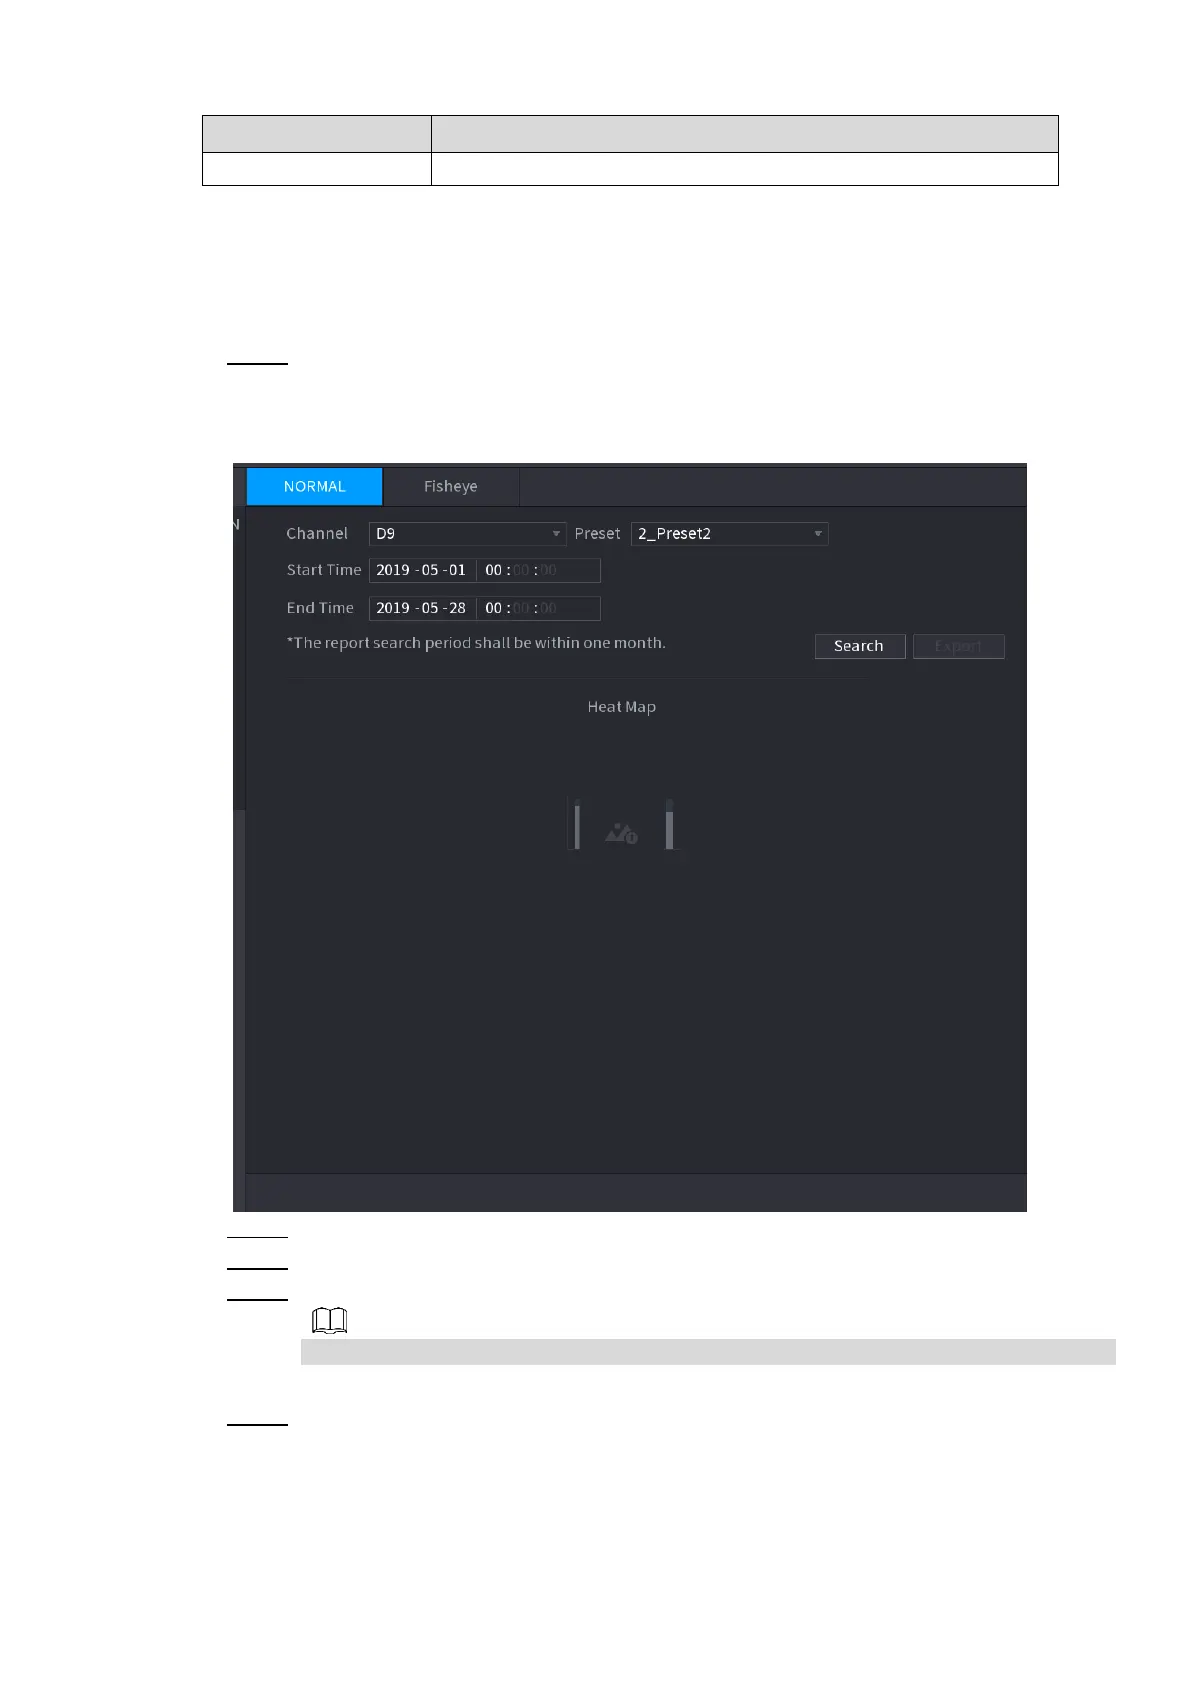
4.7.1.8.1 Normal
Step 1 Select Main Menu > AI > SMART SEARCH > HEAT MAP > NORMAL.
The Normal interface is displayed. See Figure 4-118.
Figure 4-118
Step 2 Select channel, start time, end time.
Step 3 Click Search.
Step 4 System display heat map report.
Click Export, and then select path. Click Save to save current report to the USB device.
4.7.1.8.2 Fisheye
Step 1 Select Main Menu > AI > SMART SEARCH > HEAT MAP > Fisheye.
The Fisheye interface is displayed. See Figure 4-119.
 Loading...