Graph Mode
35
View graphs of all other variables the same way.
1. Select the variable you want to view.
2. Press GRAPH.
3. Use the < and > keys to select different values.
4. Press the + key to shorten the time range.
5. Press the - key to lengthen the time range.
6. Press HI/LOW to shift between highs and lows.
7. Press DONE to exit.
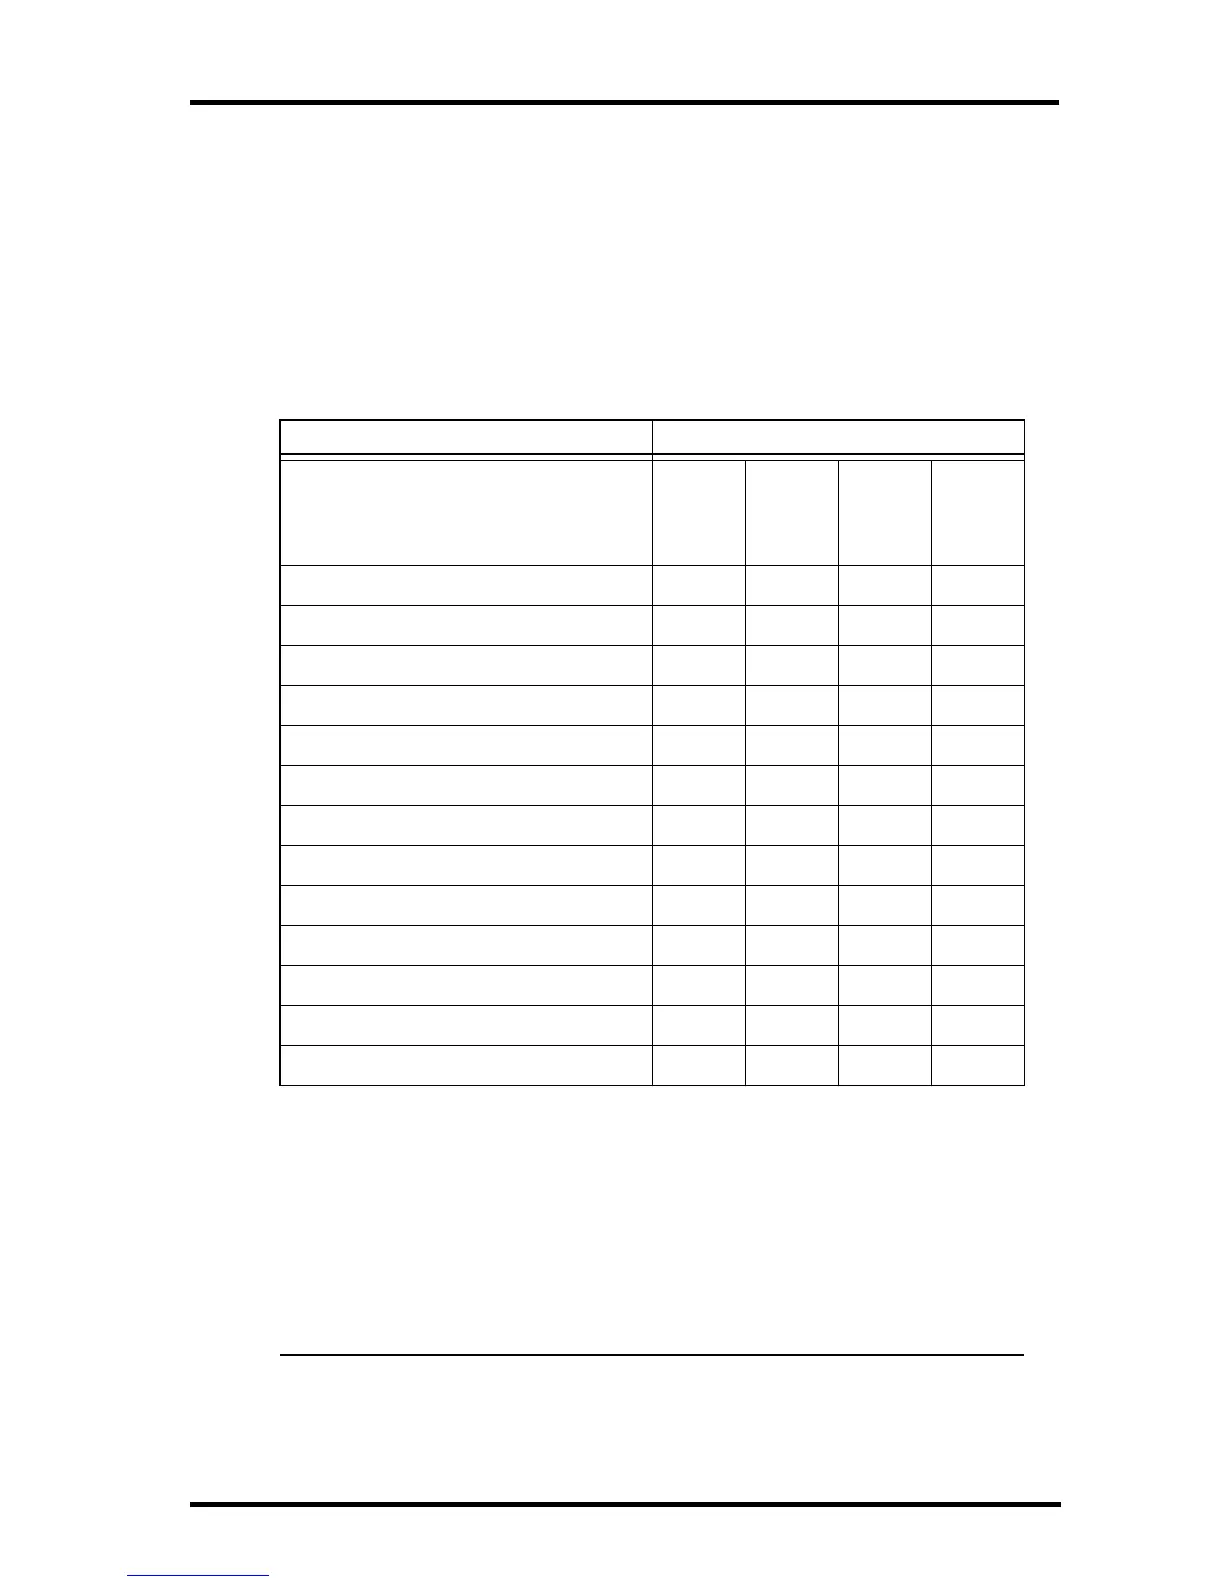
Vantage Vue Console Graphs
Weather Variable Available Graphs
Hourly
Daily
Monthly
Yearly
Barometric Pressure C H, L H, L
Humidity, Inside C H, L H, L
Humidity, Outside C H, L H, L
Dew Point C H, L H, L
Rain T T T T
Rain Rate HHHH
ET (optional) T T T T
Inside Temperature C H, L H, L
Outside Temperature C H, L H, L
Heat Index Temperature C H H
Wind Chill Temperature L L L
Wind Speed* A, H H H
Direction of High Wind Speed Y Y
Legend:
A = Average
H = Highs
L = Lows
T =Totals
Y = Yes
C = Current reading at the end of each period
* Also available: 10-Minute High Wind Speeds For Last 4 Hours; Current
and last 25 Packets of Wind Speed.
 Loading...