Graph Mode
34
The horizontal axis is time, showing the current and last 25 intervals (hours,
days, months, or years). The vertical axis scale changes automatically to fit the
information of the period graphed.
Viewing Graphs
Although the graphs available may
vary for each weather variable, all
are displayed in the same way.
1. Select a variable to graph.
2. Press GRAPH to enter Graph Mode. Only the time, date,
graph, graph icon, selected variable and information
pertaining to the selected variable are visible. The rest of
the screen is blank.
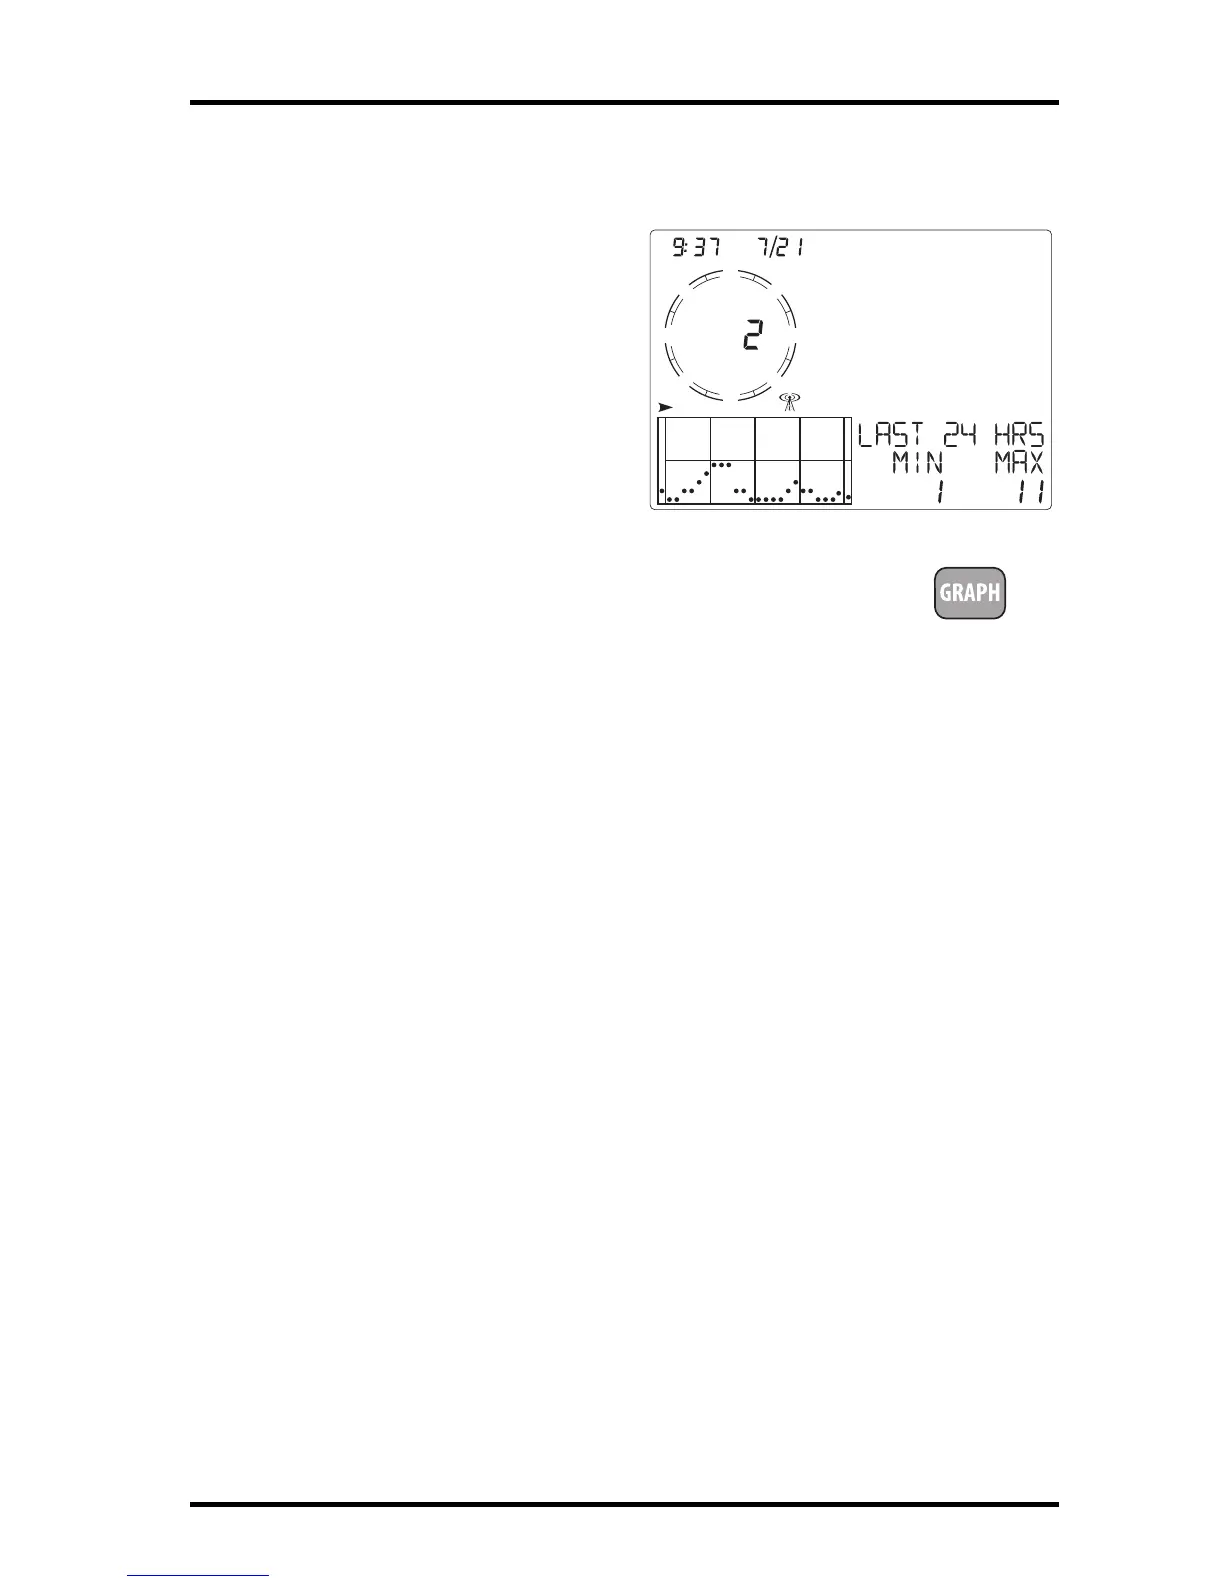
Values for the present time and each of the preceding 25 hours are displayed
in the graph, each hour represented by a dot. The dot at the right end of the
graph is the value for the current hour. You’ll notice that the dot is blinking.
The dot at the left end of the graph is the value at least 24 hours ago.
3. Press the < key and the second dot from the right starts to blink.
The screen displays the new dot’s value. The time display shows what hour
is being viewed.
4. Press the < and > keys to view the variable’s high values for each of the last
25 hours.
5. Press the + and - keys to shift the graph’s time span.
If you press the - key, the graph shifts from the current and last 25 hours to
the current and last 25 days. Each dot represents the high recorded on the
day shown in the date field. To see the lows recorded in the current and last
25 days, press HI/LOW. Press the < and > keys to move between days.
By pressing the - key again, the graph shifts to show the highs of the current
and last 25 months. As before, use the < and > keys to move between
months. Press HI/LOW to shift between the highs and lows.
By pressing the - key again, the graph shifts one more time to show the
highs of the current and last 25 years, but only for Rain Rate, Rain, and ET.
Since the console only graphs data collected by the station, graphs can only
show data collected since the station was installed.
WIND
GRAPH
MPH
am
N
S
WE
NE
SE
NW
SW
Graph Mode for the wind variable
GRAPH
 Loading...