4 • App Screens | Stelo Glucose Biosensor User Guide 25
4 • App Screens
Information in the app is divided into sections: Glucose, Events, Learn, and Settings.
Access each section using the tab at the bottom of the screen.
Glucose tab overview
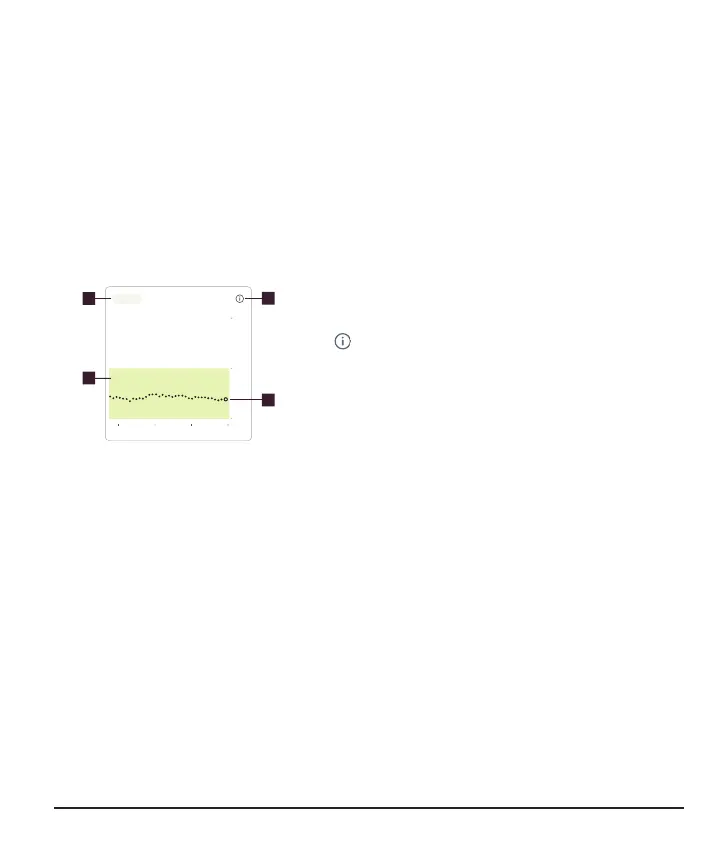
The Glucose tab shows your current reading and trend information. Tabs at the bottom
of the screen move you to other sections. Each section has multiple features.
Trend graph
3 Hours
6 12 24
250
180
70
12PM 1PM 2PM
Now
1
3
2
4
Images are representational.
Your display device screens may
look different.
1.
3 Hours, 6, 12, 24: Change the number of
hours shown on the trend graph.
2.
: Information icon. It gives you more
information about Target Range.
3.
Target Range: This is where you want your
glucose to be. It's the green box in the trend
graph.
4.
Trend graph dots: The smaller black dots
show past readings. The bigger white dot on
the right is the most recent reading.
The StelobyDexcom app may compete with other apps for battery and storage
capacity and may require certain phone settings to function.