Concurrence of Stelo Glucose Biosensor and comparator
method
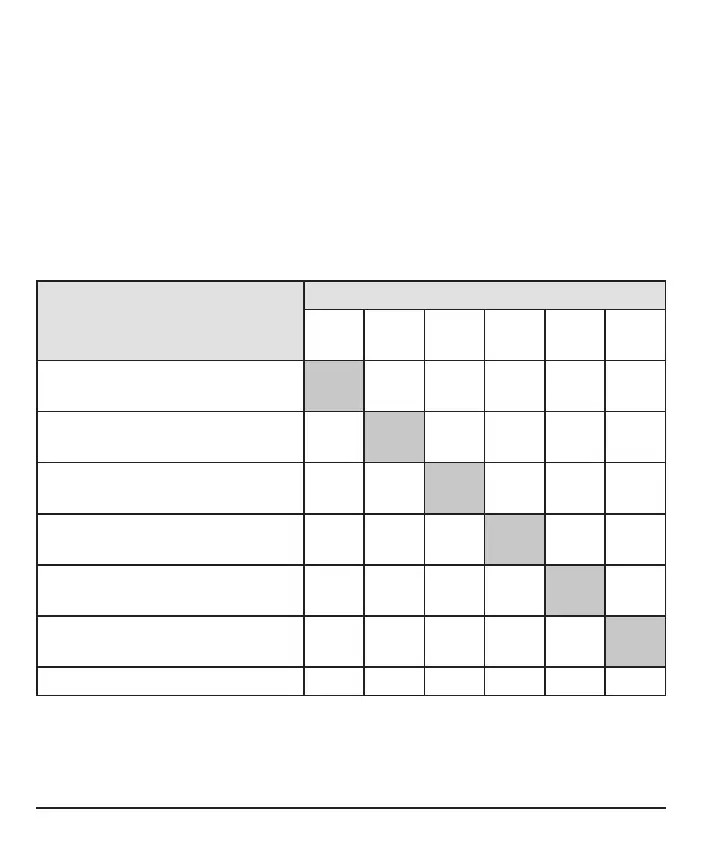
Table 2 describes (column percent), for each range of YSI values, what percentage of
paired Biosensor readings was in the same glucose range (shaded) or in glucose
ranges above and below the paired YSI values. For example, Table 2 shows that when
YSI values are within 70 to 120 mg/dL, you can expect your Biosensor readings to be
within 70 to 120 mg/dL 85.1% of the time.
Table 2. Concurrence of Biosensor readings and YSI values by YSI Glucose
Range (n=130)
Biosensor Glucose Range (mg/dL)
(Column %)
Comparator Glucose Values (mg/dL)
<70 70–120
121–
160
161–
200
201–
250
>250
<70
1,432
(72.9%)
410
(6.9%)
1
(0.0%)
--- --- ---
70–120
532
(27.1%)
5,029
(85.1%)
506
(14.7%)
13
(0.6%)
1
(0.0%)
3
(0.1%)
121–160 ---
469
(7.9%)
2,584
(75.0%)
468
(21.5%)
23
(1.1%)
3
(0.1%)
161–200 ---
3
(0.1%)
353
(10.2%)
1,487
(68.5%)
444
(22.2%)
33
(0.7%)
201–250 --- ---
1
(0.0%)
204
(9.4%)
1,350
(67.4%)
697
(14.1%)
>250 --- --- --- ---
185
(9.2%)
4,196
(85.1%)
Total 1,964 5,911 3,445 2,172 2,003 4,932
1
Biosensor readings are within 40-400 mg/dL, inclusive.
92