VigorAP 900 User’s Guide
173
3
3
.
.
1
1
4
4
.
.
3
3
T
T
r
r
a
a
f
f
f
f
i
i
c
c
G
G
r
r
a
a
p
p
h
h
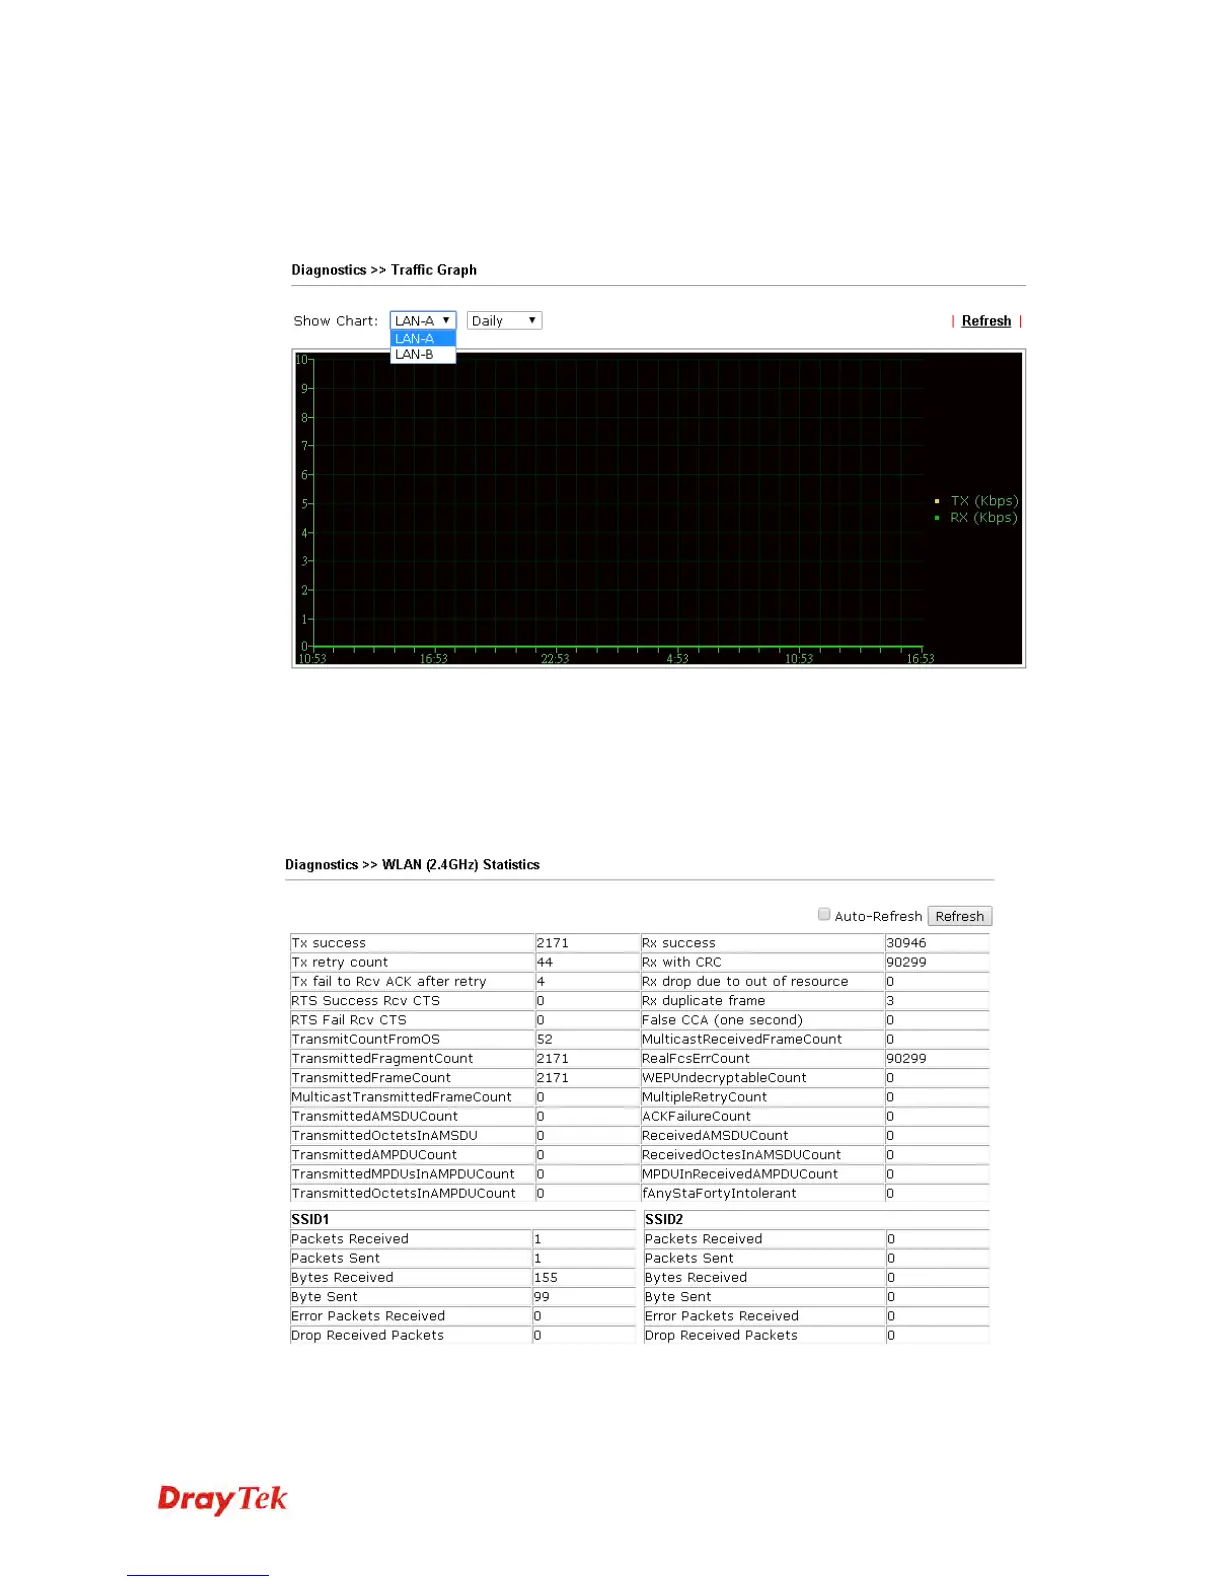
Click Traffic Graph to open the web page. Choose one of the managed Access Points,
LAN-A or LAN-B, daily or weekly for viewing data transmission chart. Click Refresh to
renew the graph at any time.
The horizontal axis represents time; the vertical axis represents the transmission rate (in
kbps).
3
3
.
.
1
1
4
4
.
.
4
4
W
W
L
L
A
A
N
N
(
(
2
2
.
.
4
4
G
G
H
H
z
z
)
)
S
S
t
t
a
a
t
t
i
i
s
s
t
t
i
i
c
c
s
s
Such page is used for debug by RD only.