VISUAL CHECK
STEP 1 – SYSTEM OPERATION
CHECKING IN THE SERVICE DATABASE
Check the runtime of the XRGI
®
system in the EC POWER service database –
https://service.ecpower.dk
Locate the desired XRGI
®
system in the search field in the service database
by typing the XRGI
®
-ID or object name.
CALL DETAILS
Click on the icon List of calls.
Click on one Time of call to get a detailed data of that call.
Check in particular for:
most recent events/alarms.
length of operating times (under 10 minutes per start implies insuffi-
cient heat dissipation) or hydraulic problems.
STORAGE STATUS
Click on the icon Heat Distributor, to get an overview of the storage
status.
Check for abnormalities with the storage status of previous switching points.
Please pay special attention to the following:
Is the TMV set point compensated (displayed as an operational set
point below the actual value)?
Are all temperatures shown in the service database and are the figures
viable?
Is the T-Return permanently below 65 °C (max. 70 °C)?
The temperature difference between TMK - TLK is ≤ 8K at full load
when operationally warm?
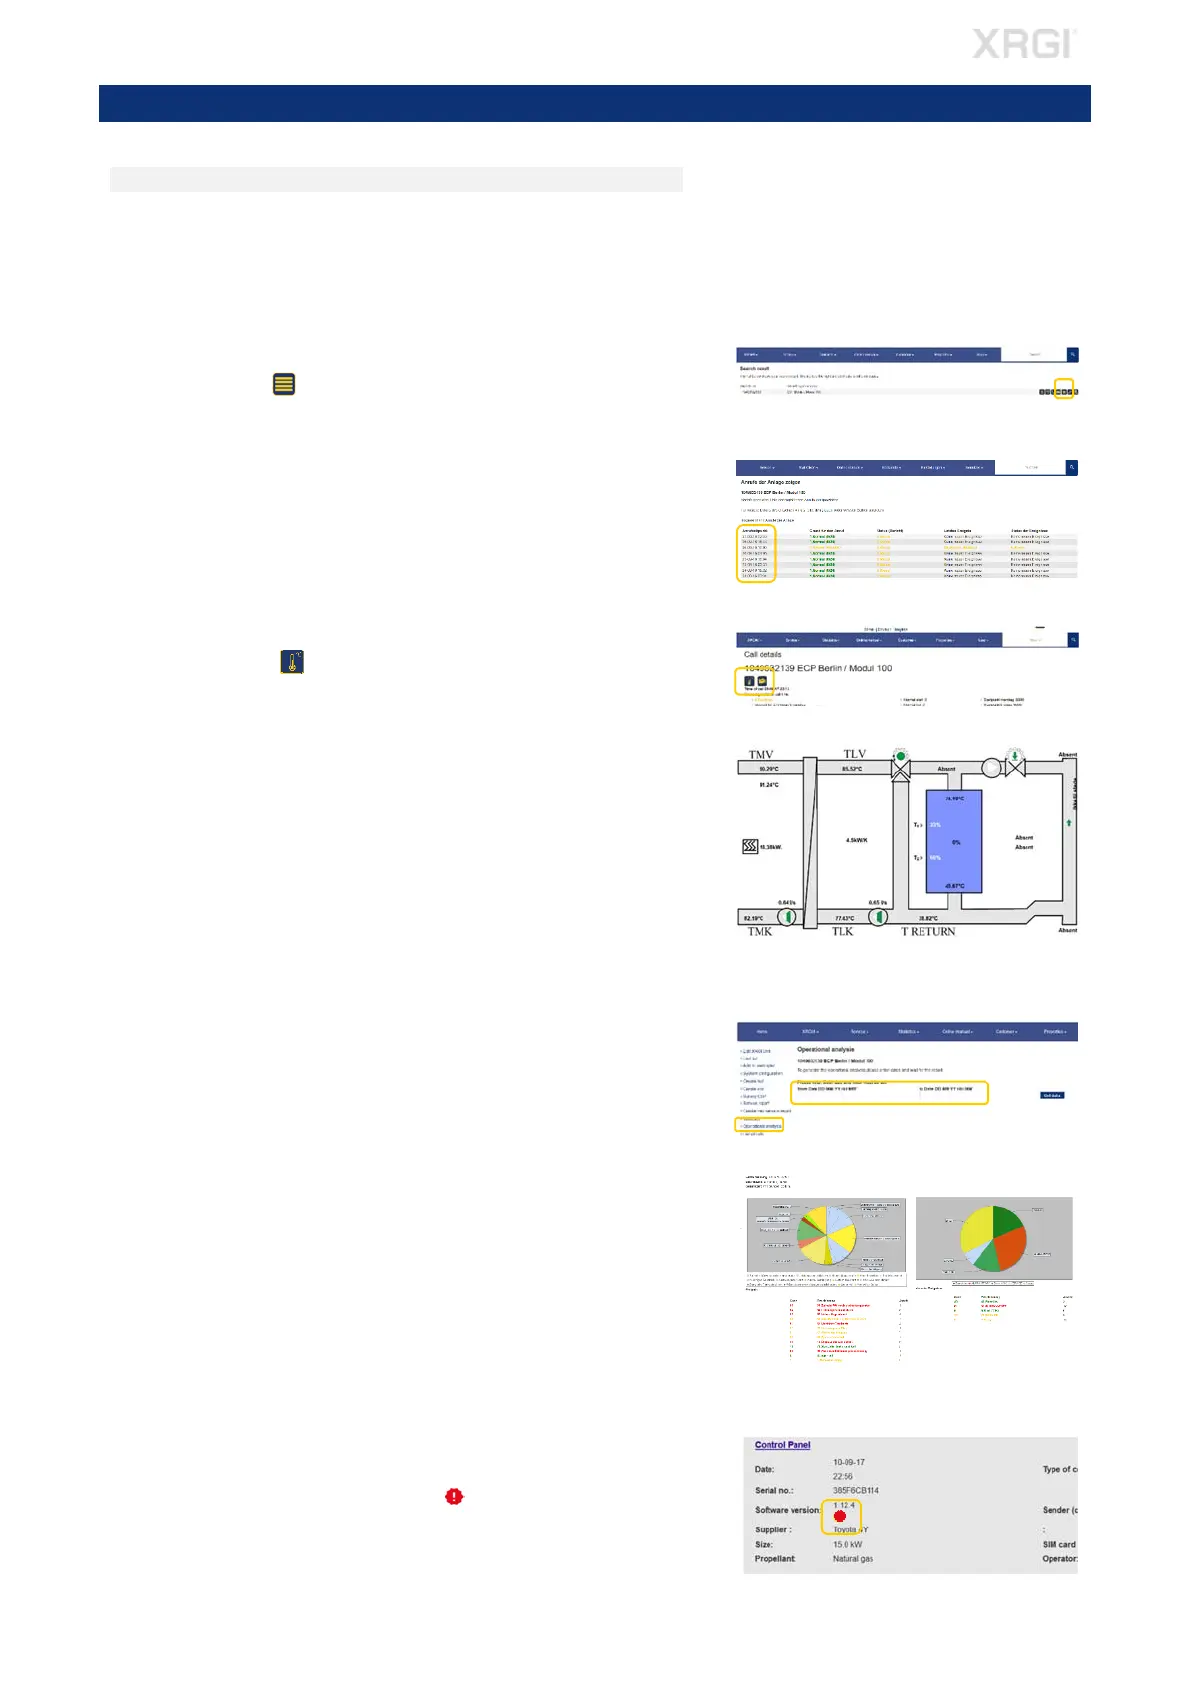
OPERATING ANALYSIS
In the left menu, click on Operational analysis and enter in the 2 search
fields a period for the desired operational analysis. Click on Get data.
Check for abnormalities in the operating analysis:
- Frequent faults
- Manual switching on site
- Operating time within the reference range
SOFTWARE VERSION
Check the software version of the XRGI
®
system.
Whether a new software is available for the XRGI
®
system is displayed
in the service database with the icon under System configuration,
System list as well as Unit list.
Fig. 3.06
Fig. 3.02
3. VISUAL CHECK
Fig. 3.03
Fig. 3.04
Fig. 3.07
Fig. 3.05
Fig. 3.01