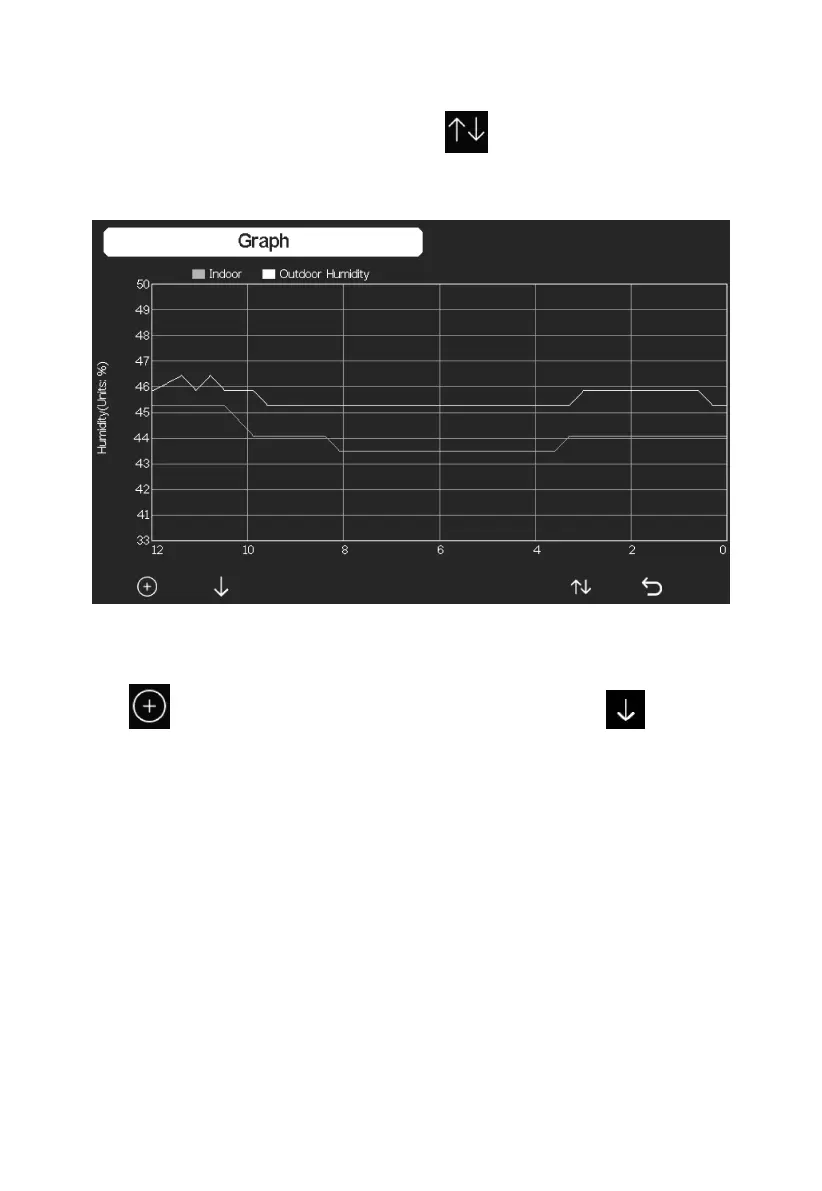
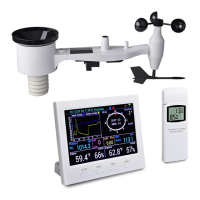
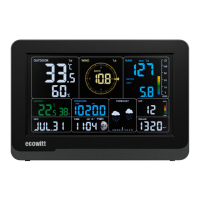
5.9.3 View Graph
While in History Record Mode, press the key three times to enter
Graph Mode.
Figure 22: Graph Screen
Press to shift the data display of 12/24/48/72H. Press to view
the graph of the following data:
Indoor outdoor temperature
Dew Point and Feels like
Indoor outdoor humidity
Wind speed and Gust
Wind Direction
UVI
Solar radiation
Rainfall hourly and daily
Barometer (REL & ABS)