Introduction
1.6 EST3 System Operation Manual
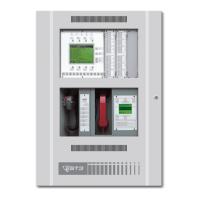
Highlight shows which event
queue is displayed in the
shaded area of the display
Total number of
events in the queue
[3SCRN2.CDR]
Event typeEvent number
Device message
System time
Alarm event queue Monitor event queue
Supervisory event queue Trouble event queue
Oldest, highest priority
event or last reviewed
event in selected event
queue
Most recent, highest
priority event
Number of disabled pointsNumber of active points
14:19:32 A0004 D0000
0003 PULL STN ACTIVE
PULL, ADMIN BLDG,
1ST FLR NORTH
S000 T001 M000
0001 PULL STN ACTIVE
PULL, ADMIN BLDG,
1ST FLR WEST
A003 |
14:19:32 A0004 D0000
0003 PULL STN ACTIVE
PULL, ADMIN BLDG,
1ST FLR NORTH
S000 T001 M000
0001 PULL STN ACTIVE
PULL, ADMIN BLDG,
1ST FLR WEST
A003 |
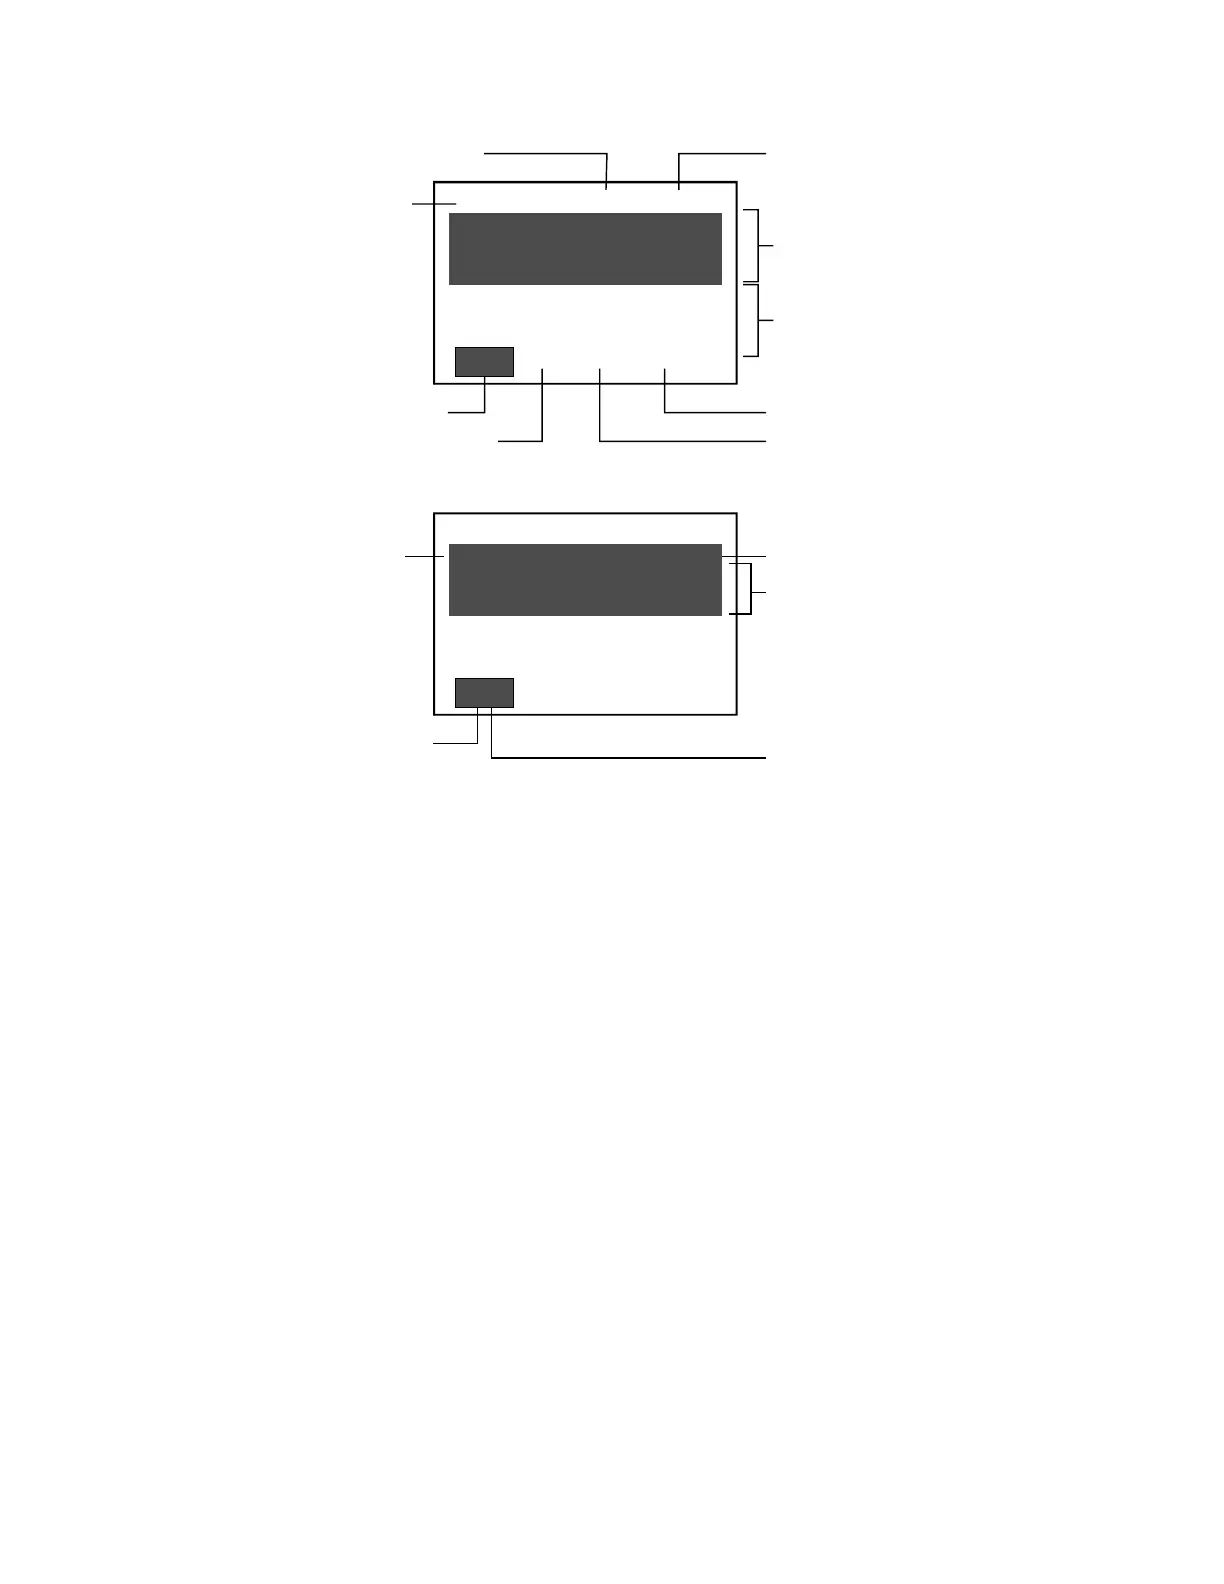
Figure 1-2: Main display screen when panel is in off-normal state
• The top line of the screen displays the system time in 24-
hour format, the number of active points in the system, and
the number of disabled points.
• The shaded area displays the oldest, highest priority, event
received by the panel, or the last reviewed event in the
selected event queue, depending on whether the display is in
unattended mode (regular off-normal operation) or in
attended mode. In either case, the display shows the event
number, the event type, and the active device's message.
Note: Pressing any one of the queue select buttons places
the display in the attended mode for reviewing or
acknowledging events and prevents the shaded area from
being updated by an event with a higher priority. The
display automatically returns to the unattended mode after
the user timeout period has expired.
• The area immediately below the shaded area always displays
the most recent, highest priority, event in an event queue.