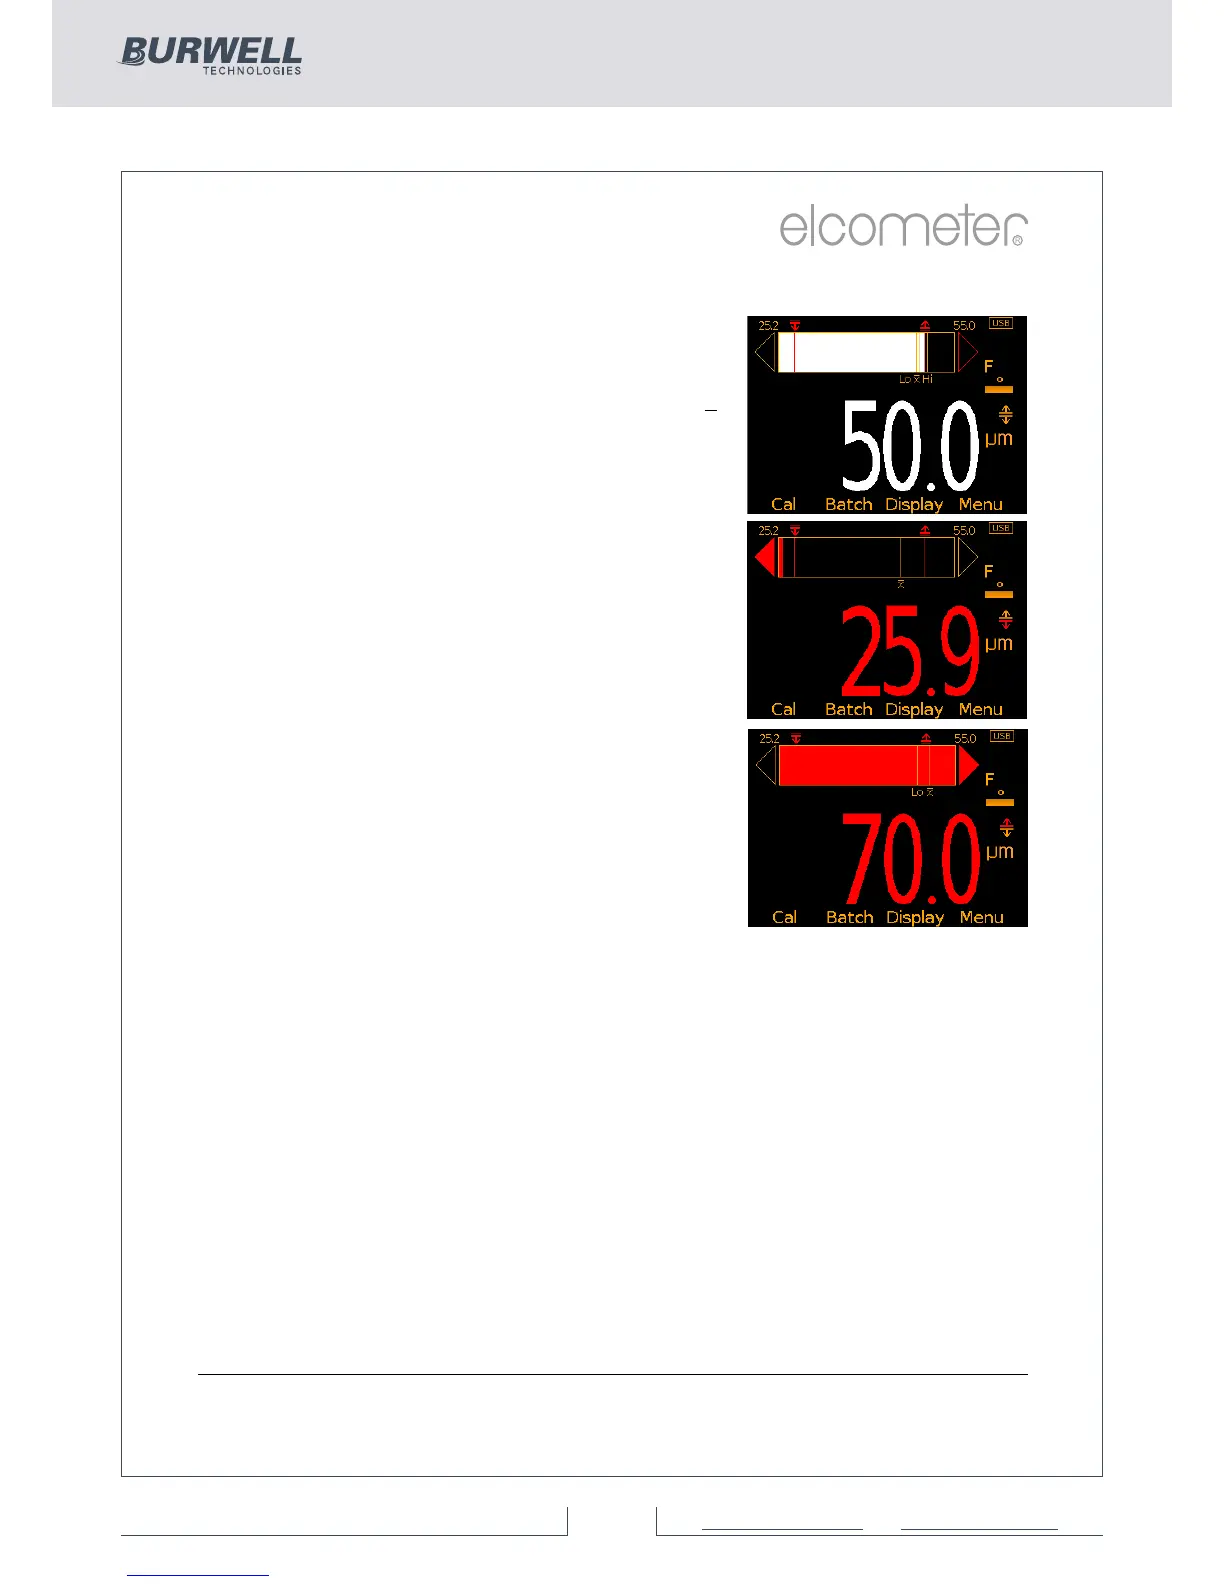
Analogue Bar Graph (BST)
By selecting Display/Readings & Bar Graph
the user can view an analogue representation
of the current thickness value together with
the highest (Hi), lowest (Lo) and average (x)
reading. The graph is updated automatically
when each reading is taken.
The values on the top left and right of the bar
signify the measurement range using the
thin calibration foil value less 10% and the
thick calibr
ation foil value plus 10%. If
calibrated using the factory calibration, the
probe scale range ±10% is used. If limits are
set, the limit values ±10% are used and the
relevant limit icon is displayed above the bar
in the appropriate position.
With Limits: The current measurement is
displayed as a white or red bar; white if
within set limits, and red if outside set limits.
If below the lower limit, the left arrow head
is also filled red and if above the upper limit,
the right arrow head is filled red.
If the next measurement taken is within set limits, the left or right arrow
outline will remain red to signify that the previous reading was outside
set limits.
Without Limits: The current measurement is displayed as a white bar.
If outside the measurement range, the left or white arrow head is also
filled white.
If the next measurement taken is within range, the left or right arrow
outline will remain white to signify that the previous reading was
outside range.
4 Users can choose to show Readings & Selected Stats (ST) - see On Screen
Statistics on page 14, Readings & Run Chart (ST) - see Run Chart on page 17,
Readings & Bar Graph (BST) or Readings Only (BST). Readings & Run Chart is
only available when in Batching, it is not available in Standard (Immediate) Mode.
R