Run Chart (ST)
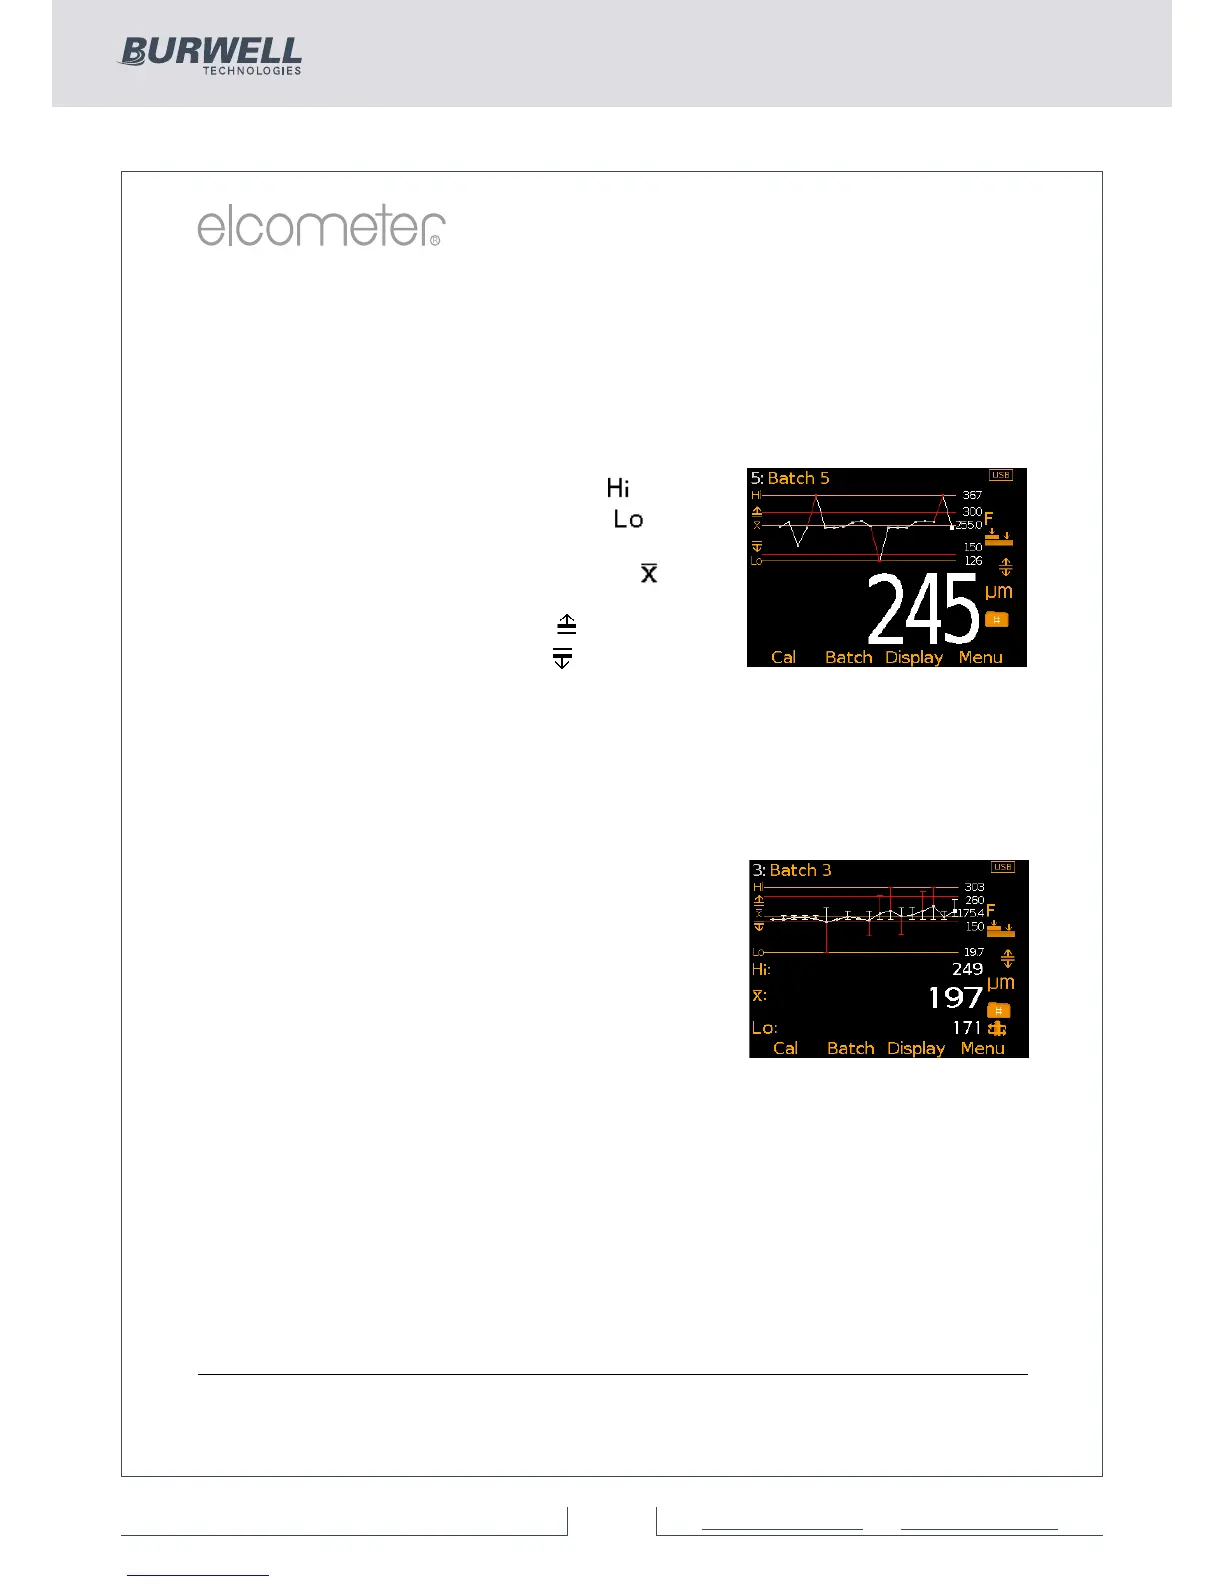
By selecting Display/Readings & Run Chart the user can view a line
trend graph of the last 20 measurements. The graph is updated
automatically when each reading is taken.
Up to five horizontal axes are displayed representing different values /
statistics as follows:
Ÿ Highest reading in the batch “ ”
Ÿ Lowest reading in the batch “ ”
(for batches of more than one reading)
Ÿ Mean of readings in the batch “ ”
(for batches of more than one reading)
Ÿ High limit for the batch “ ” (when enabled)
Ÿ Low limit for the batch “ ” (when enabled)
The readings are displayed as white or red points; white if a reading is
within limits (or no limits have been set), and red if outside set limits.
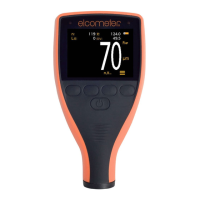
When in Scan Mode (T) - see Measurement Modes on page 25, the
Analogue Bar Graph is displayed on screen whilst scanning. This is
replaced by the Run Chart when the scan is completed.
The highest and lowest reading for each
scan is displayed on the run chart above and
below the average value together with either
a white or red vertical line; white if within set
limits, and red if outside set limits.
The highest, average and lowest reading
values for the last scan are also displayed
under the run chart.
4 Users can choose to show Readings & Selected Stats (ST) - see On Screen
Statistics on page 14, Readings & Run Chart (ST), Readings & Bar Graph (BST) -
see Analogue Bar Graph on page 16 or Readings Only (BST). Readings & Run
Chart is only available when in Batching, it is not available in Standard (Immediate)
Mode.
Time and date (ST)
Once the appropriate time and date has been set (Menu/Setup/Time and
Date), the user can display the time
and date at the top of the Elcometer
456 display via Menu/Setup/Time and Date/Display Time and Date.
www.elcometer.com
17