12
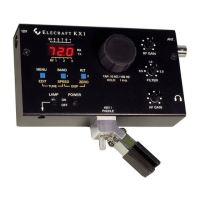
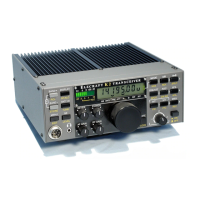
Display
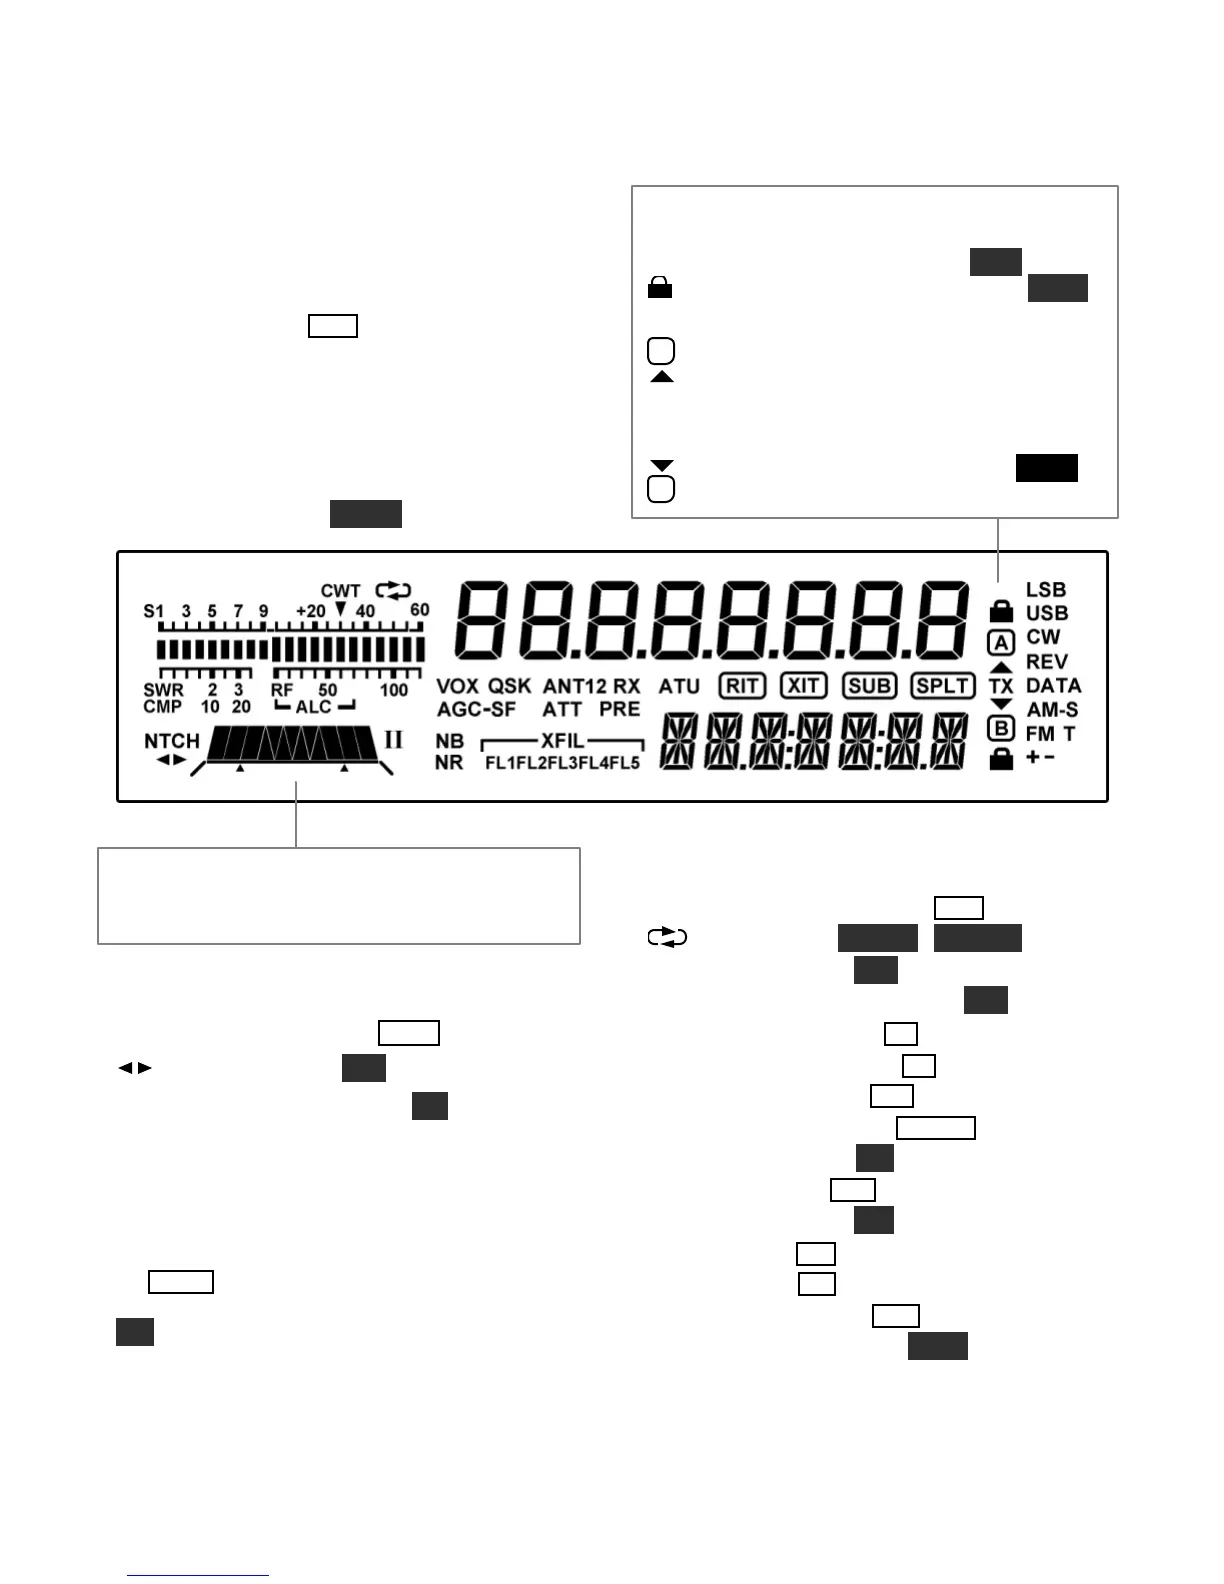
Multi-character displays: The 7-segment display
(upper) shows the VFO A frequency.The 13-
segment display (lower) shows VFO B.
Bar graph, receive mode: The bar graph normally
acts as an S-meter. If CW T is turned on, the right
half of the S-meter becomes atuning aid (pg. 34).
Bar graph, transmit mode: The bar graph
normally shows SWR and RF power output.The
RF scale will be either 5 and 10 (low power) or 50
and 100 (high power). In voice and data modes,
transmit scales can be changedto compression
(CM P) and ALC using METER.
VFO Icons: The TX icon andtwo arrows indicate
which VFO is selected for transmit as shown below.
In TXTEST mode, TX flashes (see TEST).
Shows that VFO A or B is locked (see
LOCK
).
TX
A
VFO A is the transmit VFO
TX
B
VFO B is the transmit VFO; see
Filter Graphic: This shows the approx. bandwidth
and position of the receiver’s I.F. passband. See
Filter PassbandControls, pg. 23.
Filter Icons:
NTCH Notch filteringon (N TCH , pg. 25)
Manual notch (MAN, pg. 25)
I / II Shows selected preset (I/II, pg. 14)
XFIL Crystal filter selection (FL1-FL5)
Mode Icons:
Basic modes (LSB / USB, CW, DATA, AM , or
FM ) are selected by tapping either end (Up/Down)
of MODE . Alternate modes (CW REV, DATA
REV, AM-S, FM +/-) are selected by holding
ALT. LSB and USB are alternates of each other.
T indicates FM/tone, or CW/data text decode.
Other Icons:
CWT CW/data tuning aid on (CW T , pg. 34)
DVR in use (AF R EC / AF PL AY, pg. 16)
VOX VOX enabled (VOX, pg. 13)
QSK Full break-in CW enabled (QSK , pg. 30)
NB Noise blanker on (N B , pg. 15)
NR Noise reduction on (NR , pg. 15)
AN T Antenna 1 or 2 (ANT, pg. 13)
RX RX antenna in use (RX AN T , pg. 13)
ATT Attenuator on (ATT, pg. 15)
PRE Preamp on (PRE , pg. 15)
ATU ATU enabled (ATU , pg. 13)
RIT RIT on (R I T , pg. 16)
XIT XIT on (XI T , pg. 16)
SUB Sub receiver on (SUB , pg. 37)
SPLT Split mode in effect (SPLI T, pg. 36)
SPLIT