Commissioning
55
"Signal display" menu
items
Description
Using total screen All channels are displayed over the total width. Maximum resolution in upscale direction.
Fig. 43: "Using total screen" signal display
Split zones Each channel is displayed in its own chart zone. Accuracy of the plot is not influenced in this display mode.
Fig. 44: "Split zones" signal display
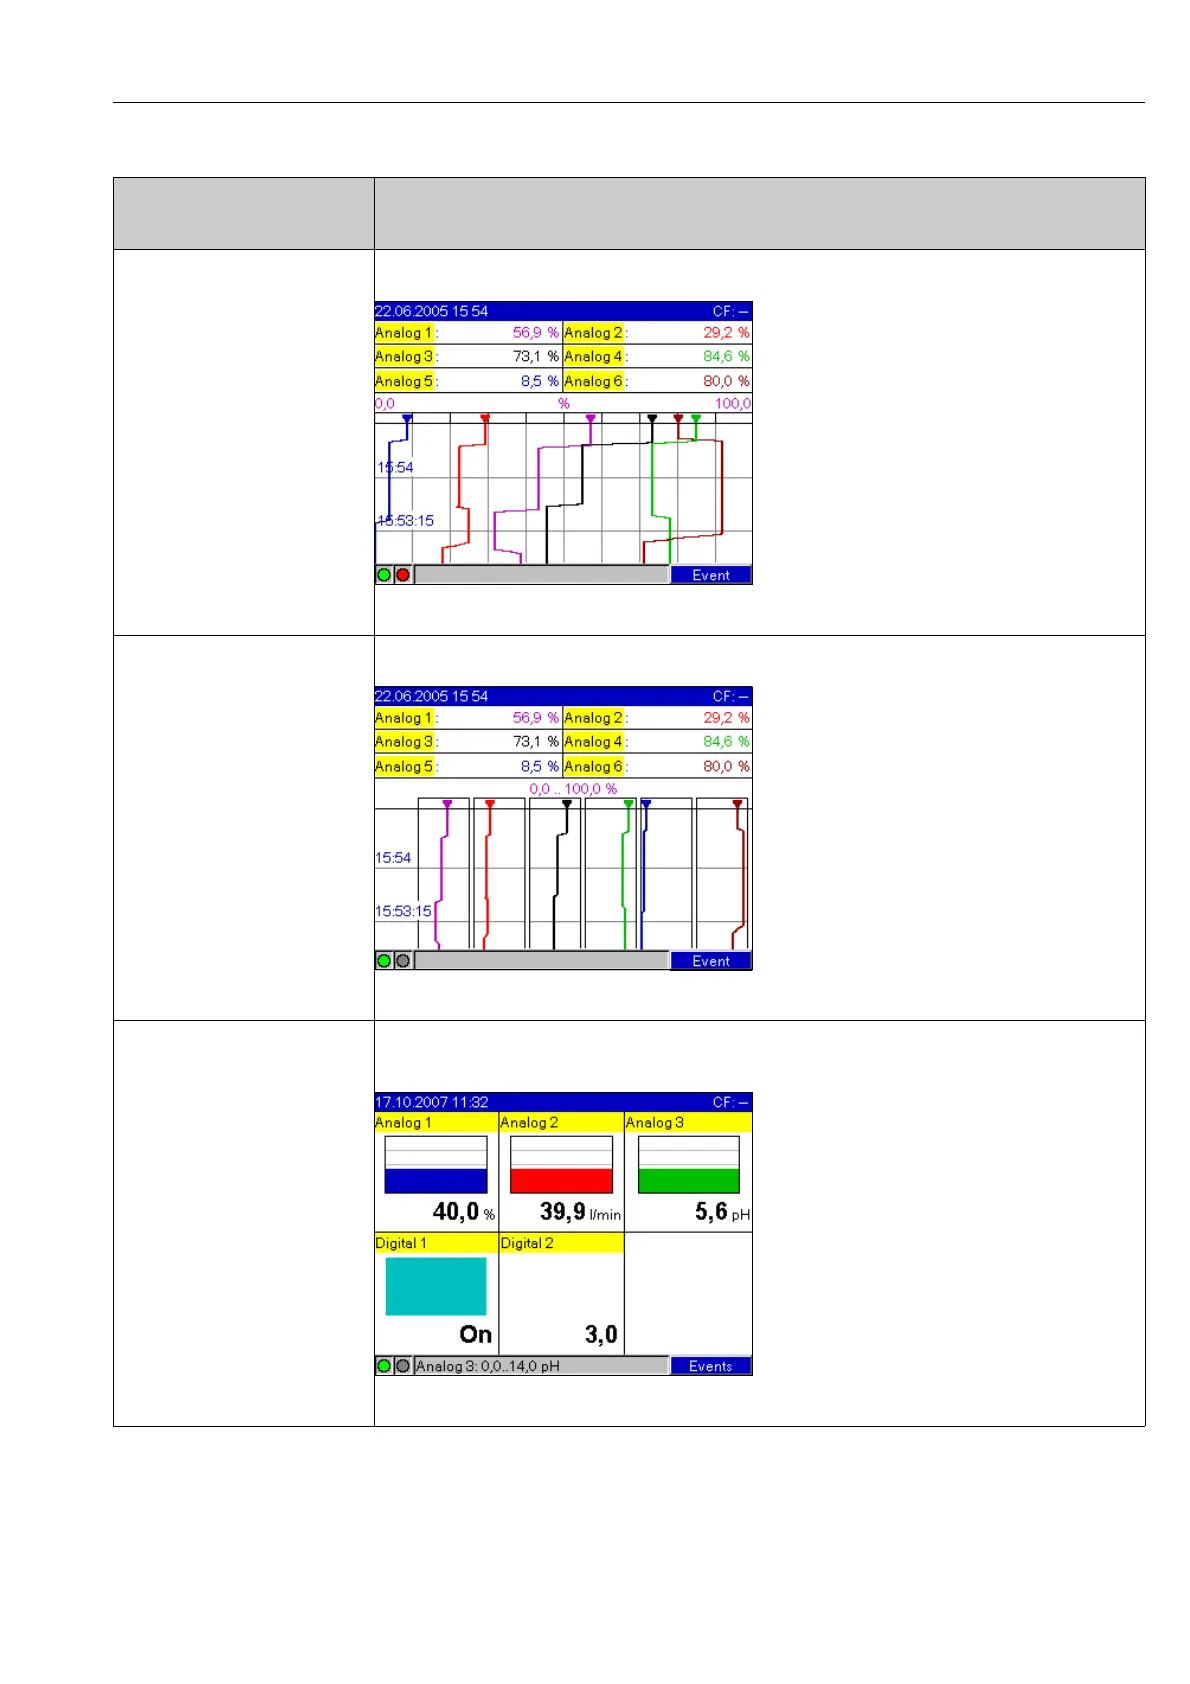
Bar graph Display of the active analog measured values as bar graphs including values. The digital input is displayed as a status or
counter/operating time counter.
Fig. 45: "Bar graph" signal display
 Loading...