SpiroSphere
®
ECG Instructions for Use
Page 31/136
Version 02.02 • 04AUG2022
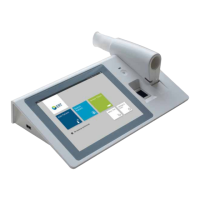
Screen display after the rst effort:
Start the next effort by tapping on <Start Effort>.
If necessary, it is possible to terminate the test prematurely.
In this case, a warning message is displayed.
* Literature:
MR Miller et al. Series “ATS/ERS Task Force: Standardisation of Lung Function Testing“,
Standardisation of Spirometry, Eur Respir J 2005; 319-338. Copyright © ERS Journals Ltd. 2005
Scroll down to display further parameters
(if applicable)
The upper left part of the chart
section shows the recording of the
ow-volume loop. The upper right
part shows the volume-time tracing.
The lower section of the screen
displays the predicted values
calculated from the patient data and
the actual values measured from
rst effort.
Pred = Predicted value
Best = Best value of all
valid efforts.
%Pred = Best value in % of
predicted values
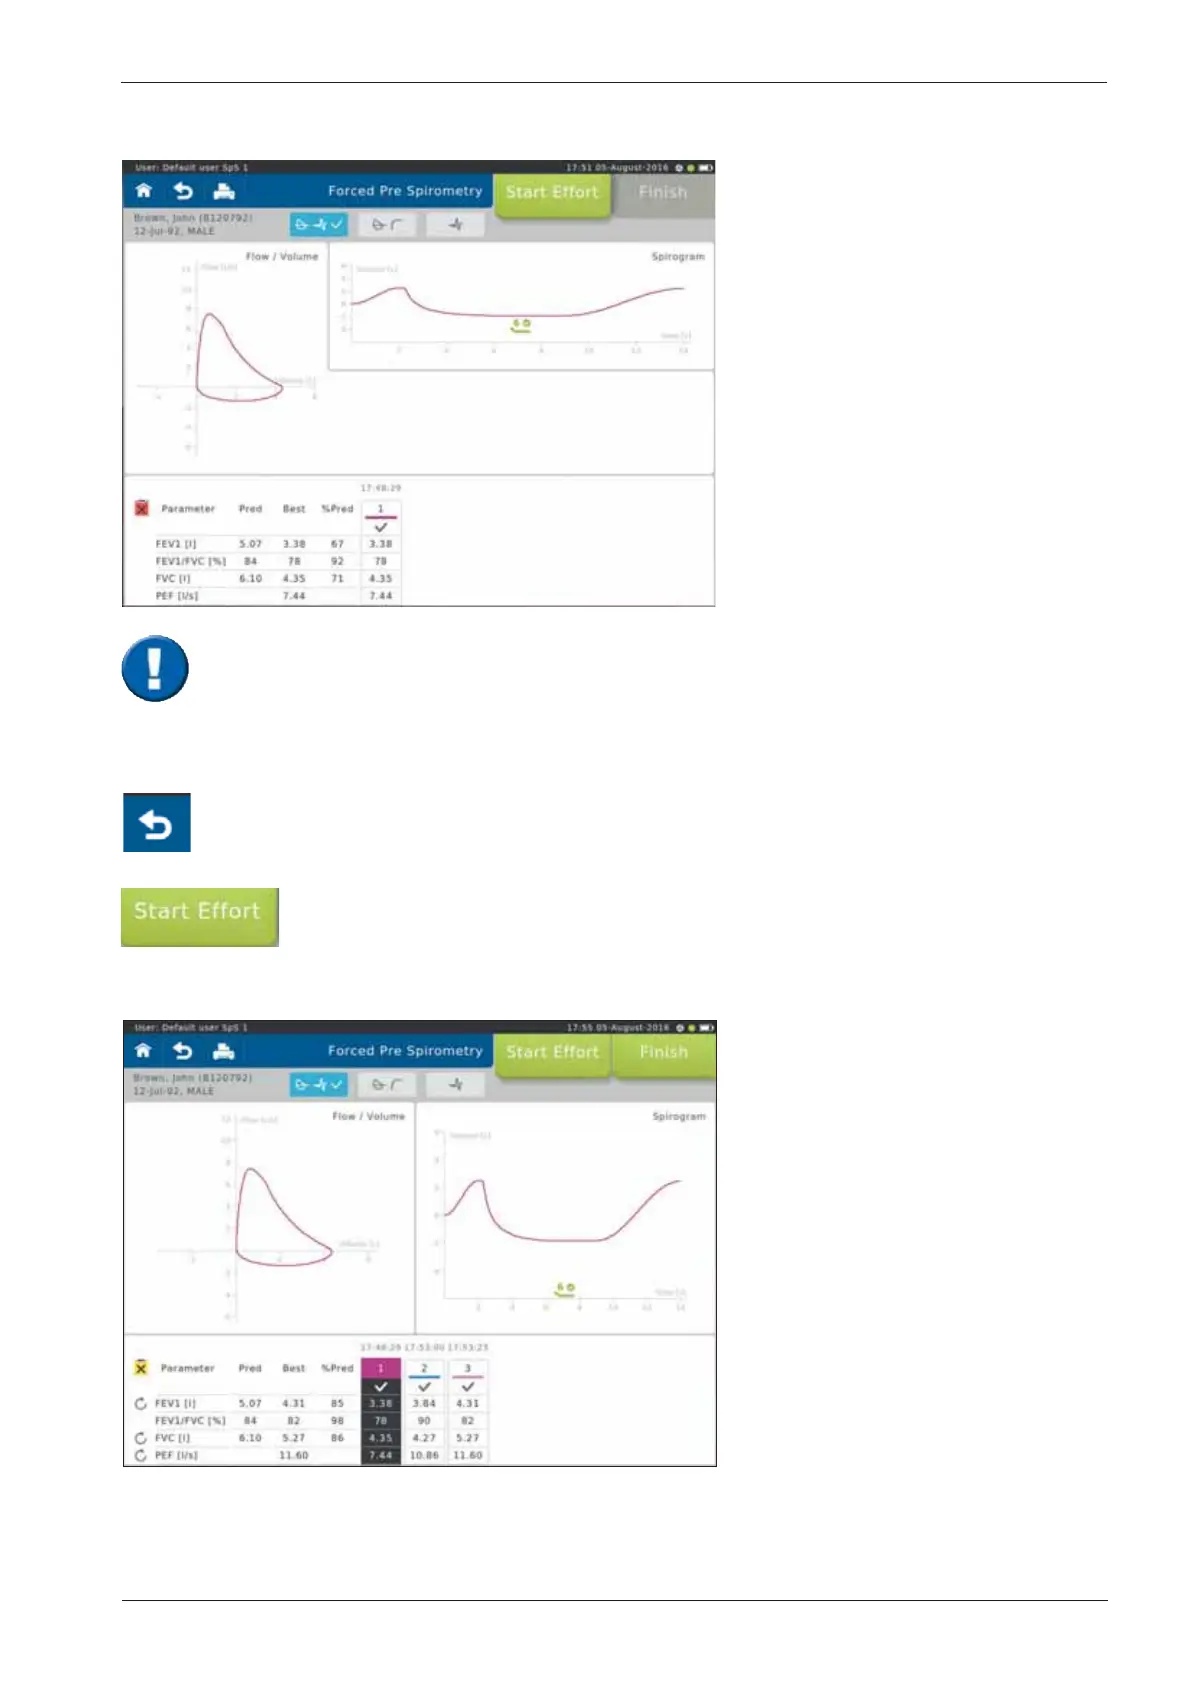
Screen display after three efforts:
The "Best" column displays the
best value out of all valid efforts.
Denition of the best effort depends
on the Settings selected
(see: >Settings Spirometry >Forced
Spirometry >Measurement).
The Tuality of the Àowvolume loop depends on the patientµs cooperation. In
order to assess repeatability and quality, it is recommended to perform at least 3 efforts
according to ATS/ERS guidelines.
The results of the best and the second best effort for FEV1 and FVC may differ by
150 mL. For FVC 1 L a difference of 100 mL is valid*.