ETAS 5 Instruments
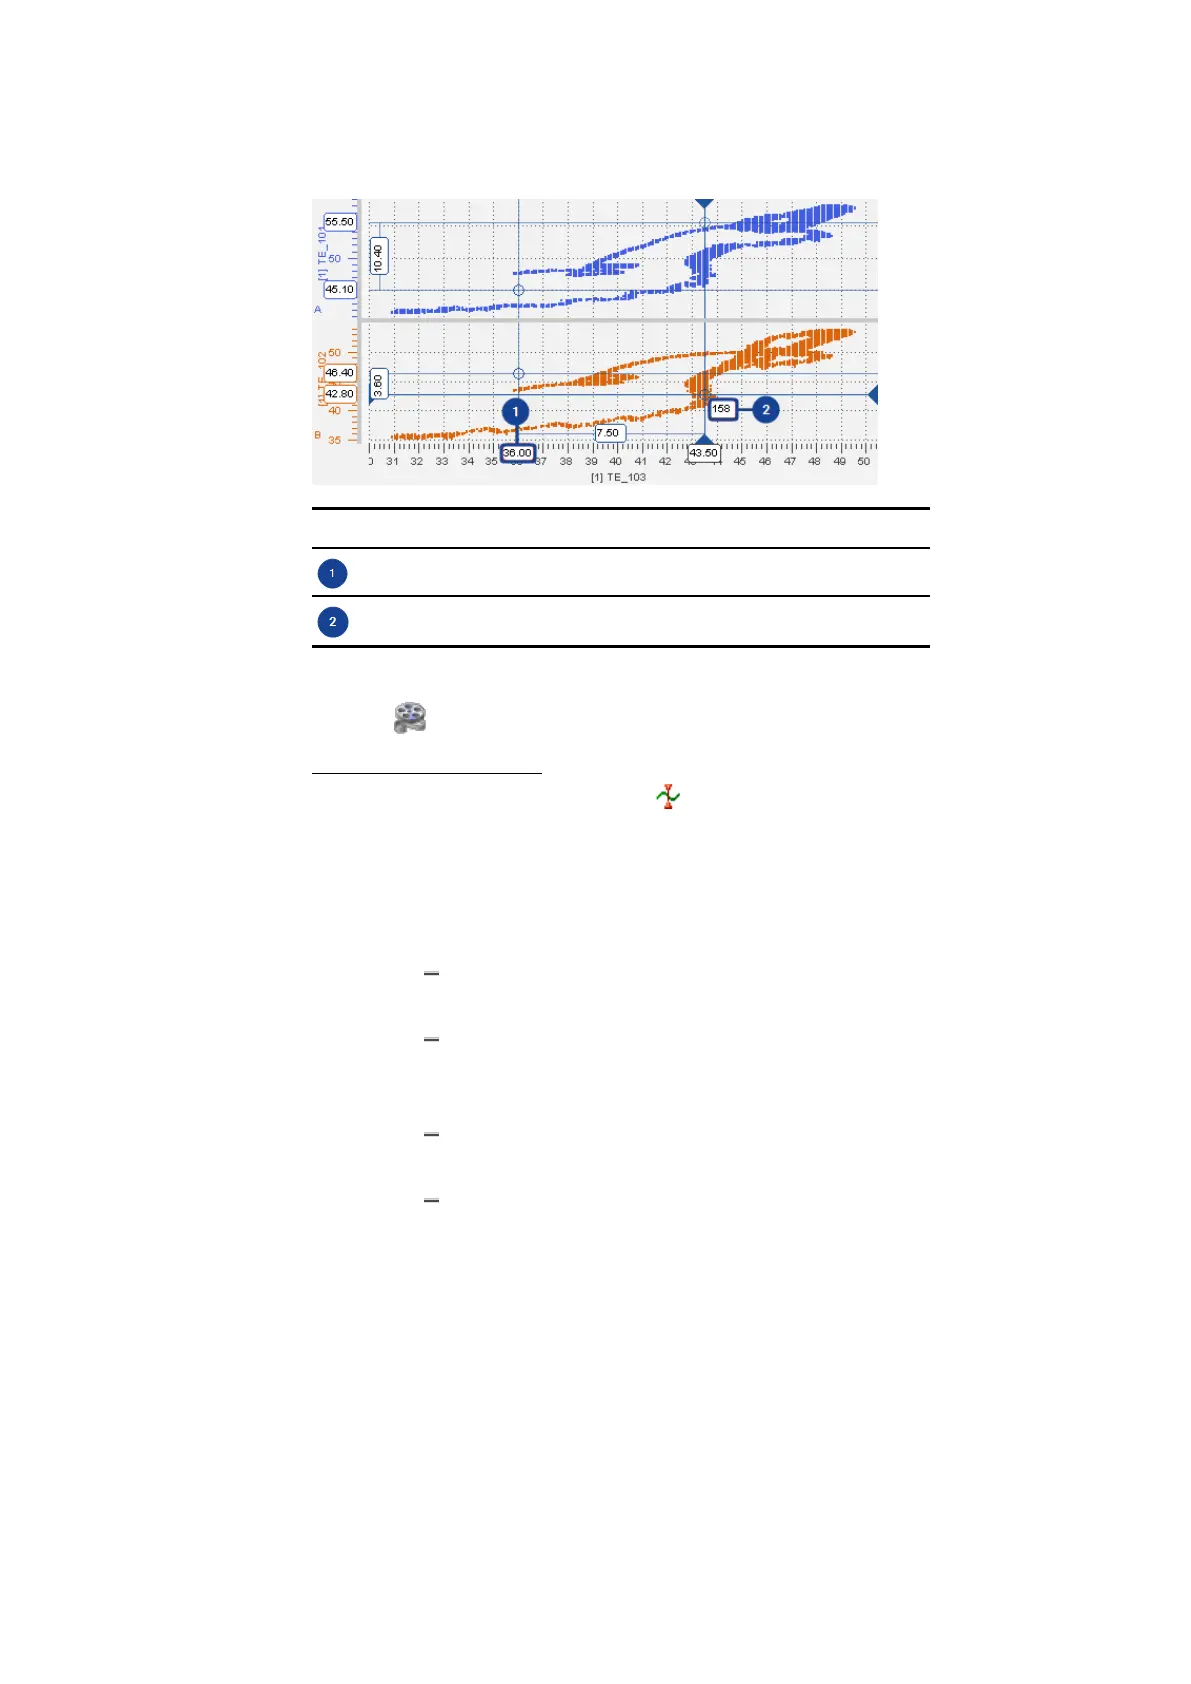
No. Description
Tooltip at the value axis displaying the signal value
Tooltip at the cross-hair of the cursors displaying the timestamp
To see how you can use the possibilities of the Scatter Plot instrument, watch
our video Instruments - Scatter Plot Basics.
To show and hide cursors
1.
To show the cursors, click .
Alternatively, press CTRL+R.
2. If you want to move a cursor to another sample, hover the mouse
cursor over one of the blue lines and drag it to the new position.
Alternatively, press the following keys:
To switch between the cursors, press ALT+ARROW LEFT/
ALT+ARROW RIGHT.
To change the cursor position, press ARROW LEFT/ ARROW
RIGHT/ ARROW UP/ ARROW DOWN.
3. Click the icon again. This has the following effect:
If both cursors have been in the visible area, they are hidden
now.
If one of the cursors has been outside the visible area, it is dis-
played now.
5.3.6 Using Bounds
You can use a bound to define a region in the scatter plot. Abound can either be
an extrapolated line or closed to a polygon depending on how you set the end-
points of the bound.
MDA V8.5 - User Guide 99
 Loading...