Page 30 © Boule Medical AB, March 2018. Article no. 1504496
3. Operation (Sample Analysis)
Results
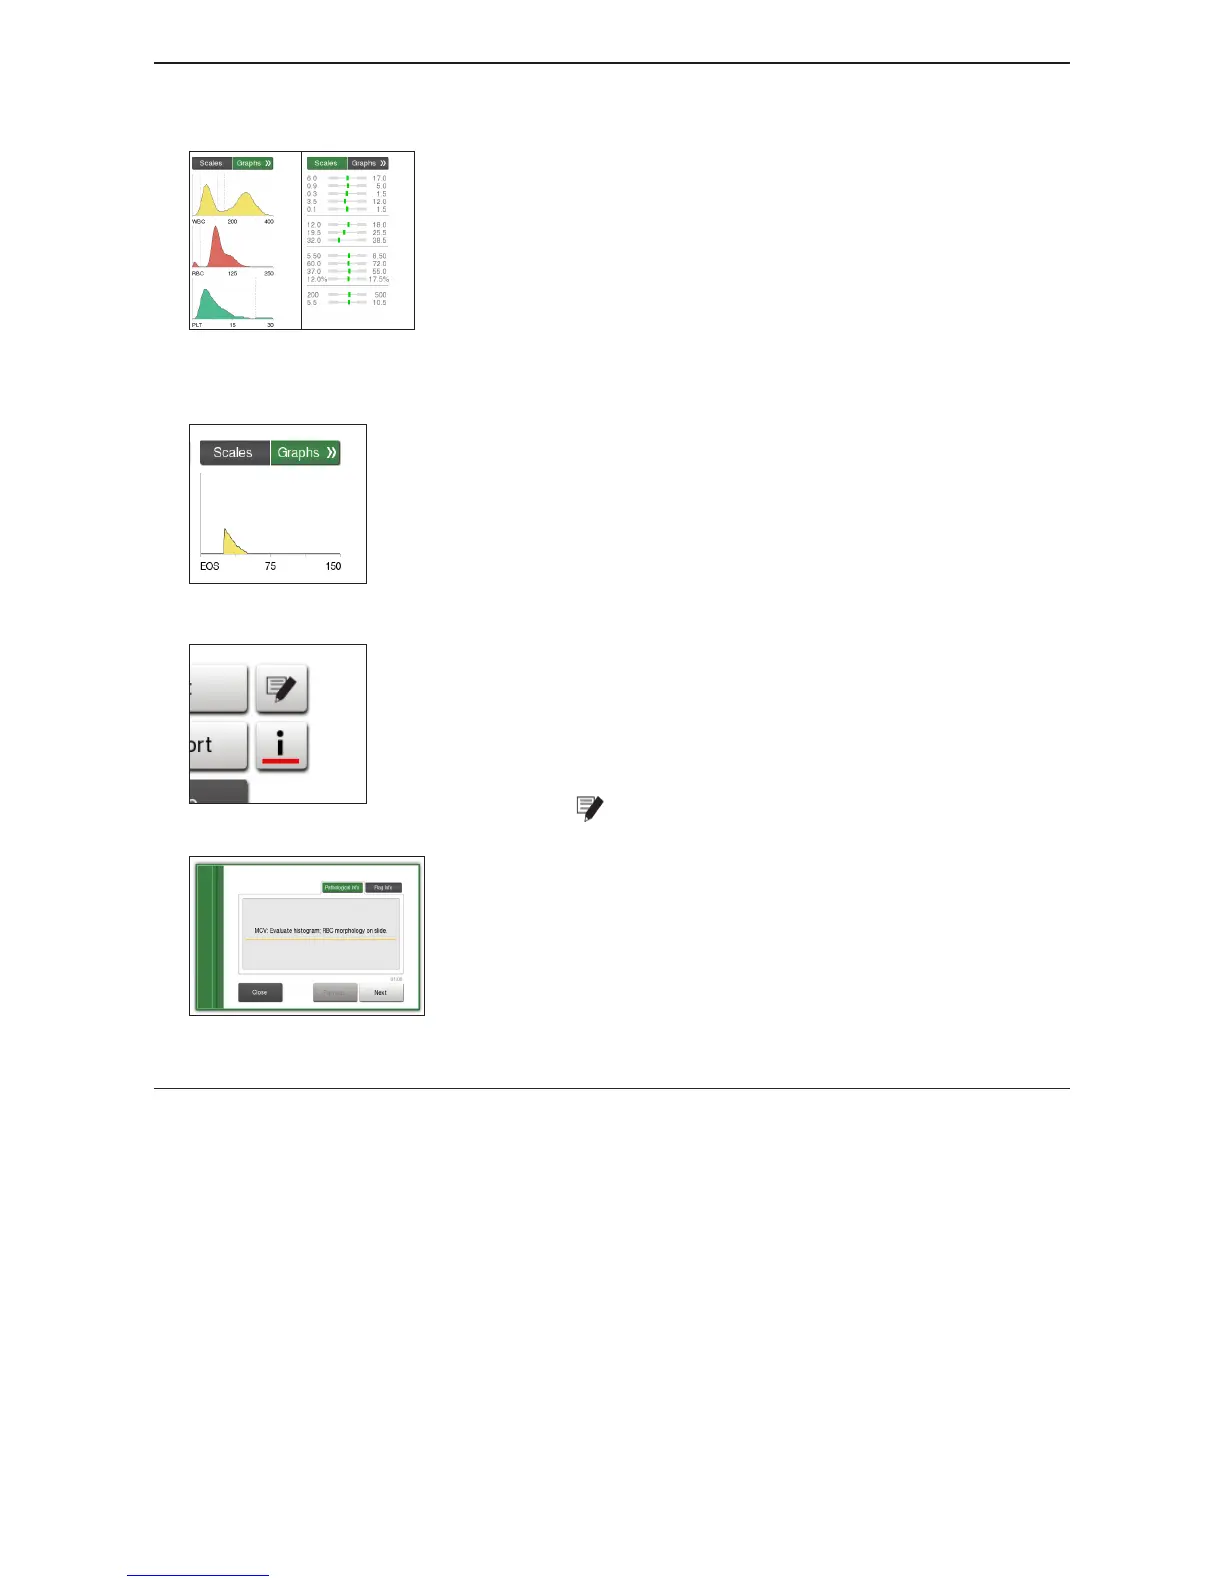
Figure 38: Distribution Curves and Scales
Section 3: Parameter Scales and Graphs
Normal range display bars with sample results
− Green bar = Result within normal range
− Red bar = Result Out-of-Range
− Purple bar = Result outside of visible bar range
RBC, PLT, and WBC distribution curves
Note: If the light gray horizontal bar becomes darker = Alert
Limits are used instead of normal ranges.
Figure 39: EOS Distribution Curve
If a prole with EOS mode is analyzed, a fourth distribution
curve is displayed for the EOS by pressing the double arrow.
Note: If EOS parameter is activated, NEU and EOS will be
displayed instead of GRA in results.
Figure 40: Function/Info button
Figure 41: Sample Pathological/Flag
Information
Section 4: Function/Information Buttons
Note: i-button is only visible when a message is present.
Press Print button to Print the sample results.
Press Export button to Export the sample results to a USB
device or host.
Press button to add notes to the sample results.
Press the i-button to see System Information, ag
information and/or Pathology Messages.
Press Close button to return to Start Menu.
Sample Results List and Search
In the Results List Menu the operator can search for previous sample analyses, view statistics, and
print/send samples and summary reports.
 Loading...