© Boule Medical AB, March 2018. Article no. 1504496 Page 29
3. Operation (Sample Analysis)
Results
Results
After a sample has been analyzed the result information will be displayed on the screen. The operator
can also search for previous sample analyses, look at statistics, and print and export them.
X New Sample Analysis Results
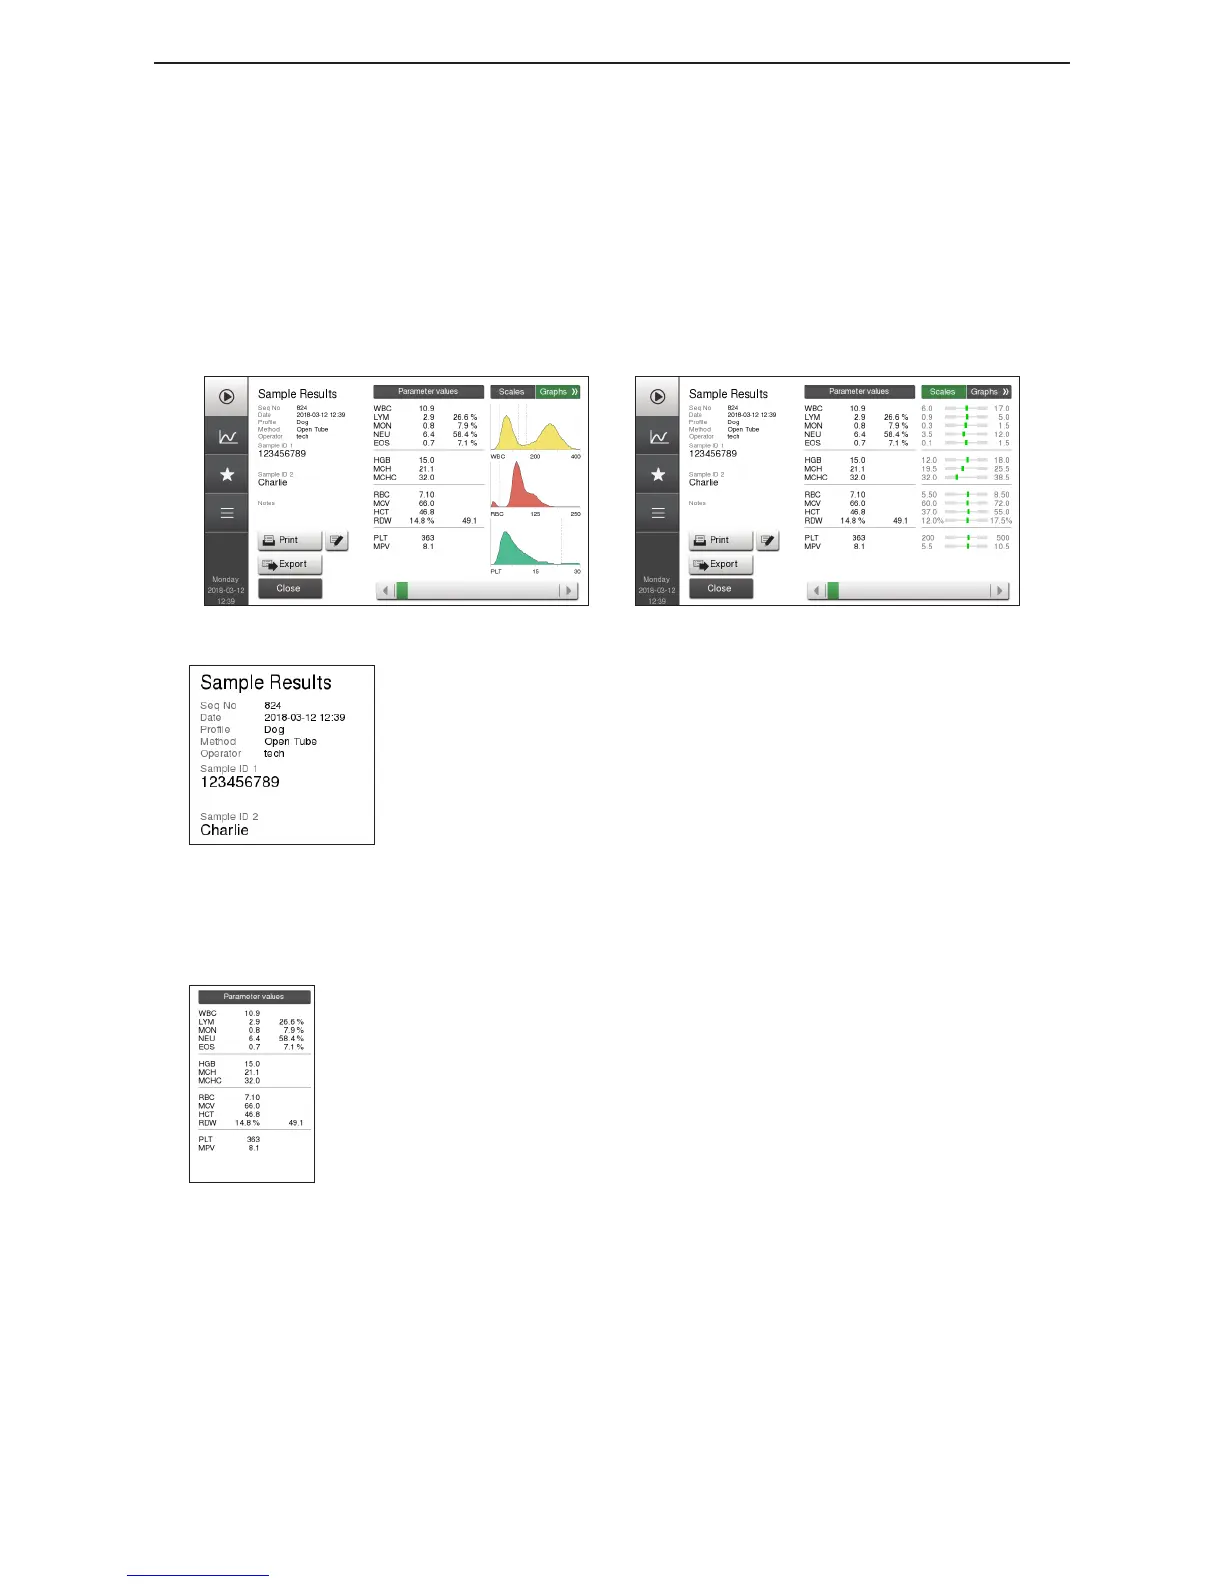
The Sample Result screen can be divided into four main sections.
Figure 34: Result Screen with graphs
Figure 35: Result Screen with scales
Figure 36: Analysis Information
Section 1: Sample Analysis Information
Sequence number
Date and time
Prole type
Method
Operator ID
Sample ID1
Sample ID2
Notes (if applicable)
Figure 37: Parameters Values
Section 2: Parameter Values
Parameter names
Parameter values
Parameter ag, more information from System Information
message
Red arrow = Result that is either higher or lower than preset
normal range
Double red arrow = Result outside of Alert Limits
 Loading...