Page 42 © Boule Medical AB, March 2018. Article no. 1504496
5. Quality Control
Quality Assurance Functions
X Levey-Jennings Plots
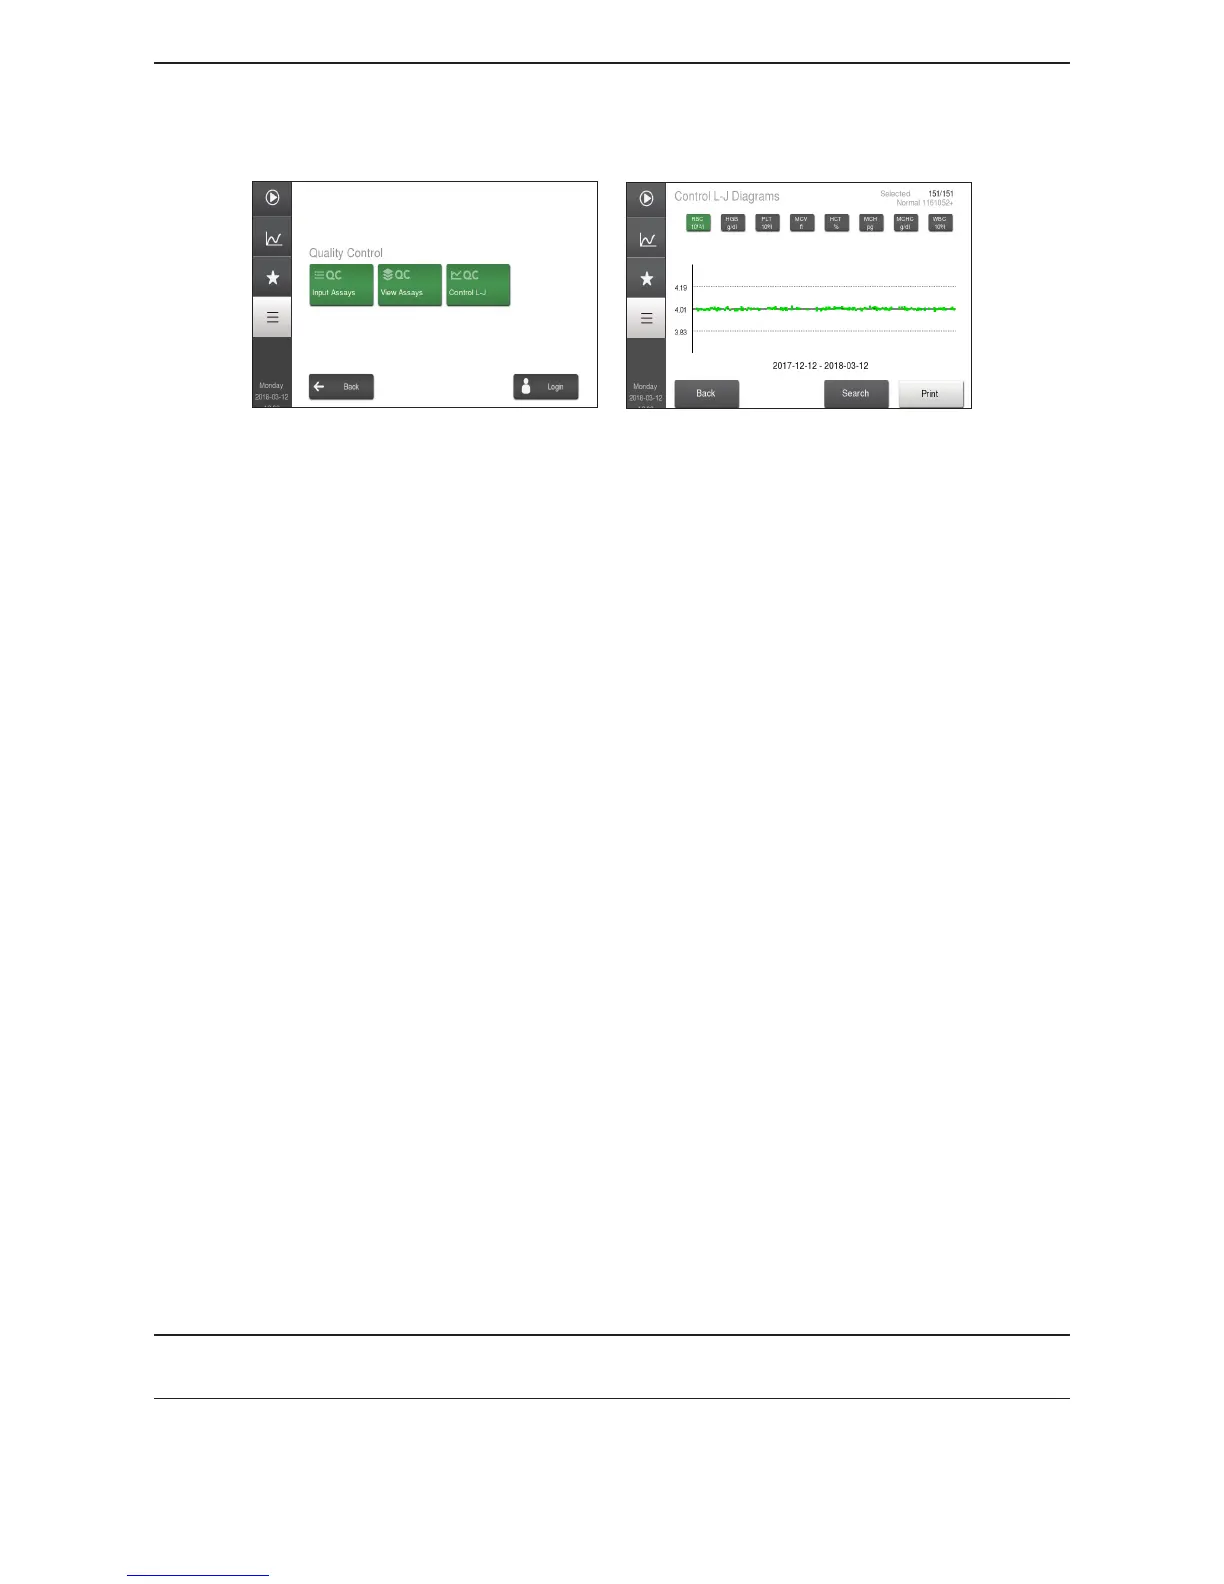
Figure 59: QC Menu
Figure 60: L-J Plot Results
1 Enter QC Mode Go to Main Menu and then select Quality Control Menu.
2 Enter Levey-Jennings Mode Select Control L-J.
3 L-J Plot Results Samples during the latest 90 days are shown as a default for
the L-J plots.
Monthly View
Select Search button and change Date Selection Mode to
Monthly.
Select Accept to save and then Control L-J button to return
to previous screen and select desired parameter.
Selected Search
Select Search button and choosing desired search criteria.
Select Control L-J to return to previous screen and select
desired parameter.
To exclude a specic sample from the L-J Plot, uncheck the
box to the right of the sample when viewing it in Sample
List.
Print L-J Plots
To print the plots on the displayed page, press Print button.
4 L-J Plot Limitations The L-J plot is constructed from several samples and will
not be shown as above until at least one accepted control
sample has been analyzed.
If a control shows a system information indicator, the
parameter values of such a control will not be included in
the L-J plots.
Plots are scaled to expected ranges dened in the assay.
Note: The L-J plots are displayed for all parameters dened in the con/cal assay values except the
WBC dierential parameter MON.
 Loading...